dFDA Cost-Benefit & ROI
Abstract
By redirecting 1% of global military spending to hyper-efficient pragmatic clinical trials, humanity can achieve 514 years of medical research in 20 years and shift the cure of every disease forward by 8.2 years, saving 416 million lives and generating $1.2 quadrillion in value.
Keywords
war-on-disease, 1-percent-treaty, medical-research, public-health, peace-dividend, decentralized-trials, dfda, dih, victory-bonds, health-economics, cost-benefit-analysis, clinical-trials, drug-development, regulatory-reform, military-spending, peace-economics, decentralized-governance, wishocracy, blockchain-governance, impact-investing
- Saves ~$41.5B Annually: Reduces global clinical trial costs (~$83B/year market) by a baseline of 50.0%, with up to 95% savings in optimal scenarios.
- 451 Return on Investment (R&D Only): A modest annual operational cost of ~$40M generates ~$41.5B in industry-wide savings, yielding an NPV of ~$249B over 10 years. Comprehensive ROI including all core benefits (R&D savings, regulatory delay elimination, and peace dividend): 1.19M (PRIMARY recommended estimate).
- Eliminates Post-Safety Efficacy Lag: By providing post-Phase I access via trial participation, a decentralized framework for drug assessment (dFDA) eliminates the 8.2-year Phase II/III efficacy lag while preserving rigorous Phase I safety testing, achieving a one-time timeline shift saving 7.94B QALYs average per year during the shift (valued at $1.19 quadrillion total economic value).
- Two QALY Estimates: Conservative bottom-up estimate of 7.94B QALYs/year from specific mechanisms; comprehensive top-down estimate of 7.94B/year including post-safety efficacy lag elimination.
- Dominant Health Intervention: Such a framework is a dominant intervention that both saves money and improves health.
- $137M+ Daily Cost of Inaction: Each day without such a framework represents a societal opportunity cost of ~$137M in economic waste and ~2,301 lost QALYs.
Executive Summary
The Problem: Clinical trials cost billions and take a decade per drug. Most humans die before the drugs that could save them finish paperwork.
The Solution: Build a global platform that lets anyone join clinical trials instantly. Real-world data replaces expensive bureaucracy. Treatments get ranked by what actually works, not what companies claim works.
What You Get
- Cost Cuts: Clinical trials cost 50-95% less. The UK’s RECOVERY trial proved you can cut costs 80-100x without killing anyone extra. Apply that globally to the $83B spent annually on trials, save tens of billions.
- More Drugs Faster: Cheaper trials mean testing rare diseases and treatments that don’t make billionaires richer. Drugs reach dying people before they finish dying.
- Fewer Dead People: The platform generates 7.94B extra life-years through the timeline shift from regulatory delay elimination, plus faster access, better prevention data, and drugs for diseases companies currently ignore.
Exceptional Economic Value
- Return on Investment (ROI): A dFDA Infrastructure has an extremely high ROI. Based on core platform operational costs (ROM estimate 40 million USD per year including medium broader initiative costs) against $50.0B in annual R and D savings (50.0% reduction scenario, see Market Size and Impact), the NPV analysis yields ROI estimates ranging from 66:1 to 2,577:1 depending on total ecosystem costs (see Full Range ROI Sensitivity Analysis), with a central estimate of approximately 451:1 over 10 years. A modest investment in global software infrastructure generates vast savings across the entire pharmaceutical R&D industry.
- Cost-Utility: A dFDA is a dominant health intervention, meaning it simultaneously saves money and improves health outcomes, far exceeding standard government value thresholds.
- Daily Opportunity Cost of Inaction: Each day we maintain the current system costs society approximately $137 million and 2,301 Quality-Adjusted Life Years.
Conclusion: A decentralized framework for drug assessment slashes costs, speeds up medical innovation, and saves lives. The math supports building it, as shown by legislative frameworks like the “Right to Trial & FDA Upgrade Act.”
Below is a conceptual, high-level analysis of the costs, benefits, and return on investment (ROI) for transforming the U.S. Food and Drug Administration’s (FDA) current regulatory framework into a “global decentralized, autonomous FDA.” This future-state platform would continuously rank treatments using the entirety of clinical and real-world data (RWD), and would enable anyone, potentially over a billion people worldwide, to participate in large-scale, continuous, decentralized pragmatic clinical trials. This analysis supports the economic rationale for initiatives such as the “Right to Trial and FDA Upgrade Act”, which proposes a foundational “FDA v2 Platform” to begin actualizing this vision within the U.S. framework, potentially serving as a model for broader global collaboration.
Because this analysis deals with a massive transformation nobody’s tried before, the numbers are estimates and ranges. But they give you a way to think about costs, savings, and what happens to medical progress.
Overview of a Decentralized Framework for Drug Assessment - Vision and Capabilities
Goals:
- A global, autonomous regulatory network (not confined to a single government entity) that continuously collects data from real-world use and decentralized pragmatic clinical trials.
- An open data architecture that aggregates anonymized health data from billions of people, covering foods, drugs, devices, supplements, and other interventions.
- Treatment rankings, continuously updated based on observational and randomized data, personalized by patient characteristics (e.g., genomics, comorbidities).
Key Capabilities
- Massive Decentralized Trials: Patients anywhere can opt in to trials comparing multiple treatments, with automated randomization, data collection (via electronic health records, wearables, apps), and analytics.
- Real-Time Surveillance: Continuous data ingestion about side effects, efficacy, interactions with other drugs/foods, and long-term outcomes.
- Reduced Administrative Overhead: Blockchain or similar decentralized infrastructure for consent management, compensation, and data integrity could replace large swaths of current paperwork, monitoring, and site management costs.
Potential Impact on the Status Quo
- Speed of Trials: Reduced overhead and automated data capture can compress timelines.
- Cost of Trials: Using existing healthcare encounters, telemedicine, and EHR data to drastically cut per-patient costs (modeled on the Oxford RECOVERY trial success).
- Scale & Scope: Potential for testing many more drugs, off-label indications, unpatentable treatments, nutraceuticals, and personalized medicine approaches.
- Innovation Incentives: Lower R&D costs can increase profitability and encourage more entrants/innovation in the life sciences.
Analysis Assumptions
- At least 1 billion people worldwide opt in to share health data in anonymized form.
- Medical records and wearable data are interoperable and standardized sufficiently to be aggregated globally.
- Robust data security and privacy technologies are in place to comply with international regulations (HIPAA, GDPR, etc.).
Cost Reductions
Decentralized trial costs modeled on Oxford RECOVERY
- Decentralized trial costs drop closer to the Oxford RECOVERY model: from an average of $40,000 - $120,000 per patient in traditional Phase III trials to roughly $500 - $1K per patient.
- Regulatory oversight is streamlined through a continuous data audit system, reducing substantial administrative overhead.
Technical Feasibility
- The necessary digital infrastructure (electronic health records, secure data exchange protocols, machine learning analytics, etc.) is assumed to be widely adopted.
- Some advanced technologies (e.g., blockchain, federated learning) achieve maturity to ensure data integrity and patient privacy.
Funding and Governance
- Start-up costs may be shared by governments, philanthropic organizations, and industry.
- Ongoing operational costs are partially offset by reduced labor needs for conventional site-based trials and by subscription or service models from industry sponsors using the platform.
These assumptions set a stage where the platform can indeed function at scale, but this remains a forward-looking scenario.
Costs for a Decentralized Framework - ROM Estimates (Partnership Model)
Section Summary - Partnership Approach
Protocol-Only Build (Recommended): - Upfront protocol/API build: $15–25M (vs. $37.5-46M for full platform) - Annual protocol operations: $5–12M (vs. $11-26.5M for full platform) - Partnership integration fund: $20-50M (one-time, to onboard Epic/Cerner/Medable) - Total initiative (partnership model): ~$40-75M upfront, $5-12M annual
Build-Everything Model (Not Recommended): - Upfront full platform build: $37.5–$46M - Annual full platform operations: $11–$26.5 million - Broader initiative (medium scenario): $228 million upfront, $21.3 million annual
Key Takeaway: The partnership approach costs 50-75% less than building a competing platform. By establishing an open protocol and leveraging existing infrastructure (Epic, Cerner, Medable, Science 37), you avoid building consumer-facing apps, trial management systems, and global EHR integrations. The protocol layer costs $15-25M to build vs. $500M+ for a full-stack solution.
Existing Infrastructure Value: Companies like Medable ($521M raised), Science 37 ($100M raised), Epic, and Cerner have already invested $1B+ in infrastructure that can be integrated rather than replicated.
This section provides a Rough Order of Magnitude (ROM) cost estimate based on a partnership-first strategy where a dFDA provides open protocol infrastructure rather than competing with existing platforms.
Upfront (Capital) Expenditure Initial Build Illustrative 30 Months
Core Engineering & Development Effort:
- Basis: ~75 FTEs 2.5 years $200k/FTE/year
- Activities: Detailed design, core platform development (API, storage, mapping/validation, auth), reference frontend, initial plugin interfaces, testing, documentation, initial deployment.
The engineering cost is calculated as:
\[ C_{\text{engineering}} = N_{\text{FTEs}} \times T \times C_{\text{FTE}} = 75 \times 2.5 \times \$200\text{k} = \$37.5\text{M} \]
Where \(N_{\text{FTEs}} = 75\) is the number of full-time equivalents, \(T = 2.5\) years is the development timeline, and \(C_{\text{FTE}} = \$200\text{k}\) per FTE per year.
- Estimated ROM: $35 - $40M
Infrastructure Setup & Initial Cloud Costs:
- Activities: Establishing cloud accounts, VPCs, Kubernetes cluster (EKS) setup, database provisioning (RDS/TimescaleDB), S3 buckets, CI/CD pipeline setup, initial IaC development (Terraform).
- Costs: Includes initial compute/storage during development/testing, potential small upfront reservations.
- Estimated ROM: $1 - $3 Million
Software Licenses & Tooling (Initial):
- Examples: Potential costs for monitoring tools (Datadog), security scanners (Snyk), specialized libraries, collaboration tools if not already covered.
- Estimated ROM: $0.5 - $1 Million
Compliance, Legal & Security (Initial Setup):
- Activities: Initial HIPAA/GDPR compliance assessment, policy development, security architecture review, legal consultation for data sharing frameworks.
- Estimated ROM: $1 - $2 Million
The total upfront cost is the sum of all components:
\[ C_0 = C_{\text{engineering}} + C_{\text{infrastructure}} + C_{\text{software}} + C_{\text{compliance}} \]
Where:
- \(C_{\text{engineering}} = \$35 - \$40\) million (Core Engineering & Development)
- \(C_{\text{infrastructure}} = \$1 - \$3\) million (Infrastructure Setup & Initial Cloud Costs)
- \(C_{\text{software}} = \$0.5 - \$1\) million (Software Licenses & Tooling)
- \(C_{\text{compliance}} = \$1 - \$2\) million (Compliance, Legal & Security)
Total Estimated Upfront Cost (ROM): $37.5 - $46M
Note: This ROM estimate focuses only on the Core Platform build effort and associated setup. It represents the foundational first step. The full vision of the “Right to Trial and FDA Upgrade Act” requires significant additional investment in broader initiatives to achieve its goals of global integration, legal harmonization, and massive scale. These crucial, follow-on costs are estimated separately in the Scenario Based ROM Estimates for Broader Initiative Costs section below and include:
- Global EHR/Data Source Integration Effort: Building/buying connectors for thousands of systems worldwide.
- Large-Scale Plugin Development: Funding the ecosystem of data importers, analysis tools, and visualization plugins.
- International Legal/Regulatory Harmonization: Major diplomatic and legal efforts to create a global standard.
- Global Rollout & Adoption: Costs associated with driving adoption and providing training worldwide.
- Massive-Scale Infrastructure: Scaling hardware and cloud resources beyond initial targets to support millions of users as mandated by the Act.
The following sections provide ROM estimates for both the ongoing operational costs of the core platform and for these essential broader initiatives.
Top-Down Analogous Cost Estimation (Market Comparables)
To complement the bottom-up ROM, you can derive a top-down estimate by examining the total investment raised by leading commercial companies developing decentralized clinical trial (DCT) platforms. This market-based view provides a real-world benchmark for the capital required to build, scale, and operate a sophisticated, global-grade platform.
- Medable: A leader in the DCT platform space, has raised a total of $521 million in capital, achieving a valuation of $2.1 billion as of late 2021. This level of funding represents the capital required to develop a comprehensive SaaS platform, establish a global presence across 60+ countries, and achieve significant market penetration.
- Other DCT Platform Companies: Other companies in the space, such as Science 37 (~$40M raised), Thread (up to $50M raised), and uMotif (~$25.5M raised), show that you can achieve significant traction and platform development with investments in the tens of millions.
Analogous ROM Conclusion
Based on these market comparables, the total investment required to fund a global initiative for a decentralized framework for drug assessment, from initial build to widespread adoption, can be estimated to be in the range of $50 million to $500M.
- The lower end (~$50M) covers building a solid platform and achieving initial scale, similar to companies like Science 37 or Thread.
- The upper end (~$500M+) reflects the multi-year investment for a market-leading, feature-rich global platform with extensive third-party tools, analogous to Medable’s trajectory.
This top-down estimate matches the bottom-up analysis. While a core, open-source platform can start for tens of millions (upfront build ROM), a fully-realized, globally adopted decentralized framework for drug assessment represents a multi-hundred-million-dollar undertaking, consistent with “Medium Case” and “Worst Case” scenarios.
Annual Operational Costs Illustrative at Target Scale of 5M MAU 50TB Ingest Month
Cloud Infrastructure Costs (AWS):
- Components: EKS cluster, RDS/TimescaleDB hosting, S3 storage & requests, SQS messaging, API Gateway usage, Data Transfer (egress), CloudWatch logging/monitoring.
- Basis: Highly dependent on actual usage patterns, data retrieval frequency, processing intensity. Assumes optimized resource usage.
- Estimated ROM: $5 - $15 Million / year (Very sensitive to scale and usage patterns)
Ongoing Engineering, Maintenance & Operations:
- Team Size: Assume ~20 FTEs (SREs, DevOps, Core Maintainers, Security).
- Basis: 20 FTEs * $200k/FTE/year
The ongoing engineering cost is calculated as:
\[ C_{\text{engineering}}^{\text{ops}} = N_{\text{FTEs}}^{\text{ops}} \times C_{\text{FTE}} = 20 \times \$200\text{k} = \$4\text{M}/\text{year} \]
Where \(N_{\text{FTEs}}^{\text{ops}} = 20\) is the number of FTEs for ongoing operations.
- Estimated ROM: $4 - $6 Million / year
Software Licenses & Tooling (Ongoing):
- Examples: Monitoring (Datadog/New Relic), Error Tracking (Sentry), Security Tools, potential DB license/support costs at scale.
- Estimated ROM: $0.5 - $1.5 Million / year
Compliance & Auditing (Ongoing):
- Activities: Regular security audits (penetration tests, compliance checks), maintaining certifications, legal reviews.
- Estimated ROM: $0.5 - $1 Million / year
Support (User & Developer):
- Activities: Tier 1/2 support for platform users and potentially third-party plugin developers.
- Estimated ROM: $1 - $3 Million / year (Scales with user base)
The total annual operational cost is the sum of all components:
\[ C_{\text{op}} = C_{\text{cloud}} + C_{\text{engineering}} + C_{\text{software}} + C_{\text{compliance}} + C_{\text{support}} \]
Where:
- \(C_{\text{cloud}} = \$5 - \$15\) million/year (Cloud Infrastructure Costs)
- \(C_{\text{engineering}} = \$4 - \$6\) million/year (Ongoing Engineering, Maintenance & Operations)
- \(C_{\text{software}} = \$0.5 - \$1.5\) million/year (Software Licenses & Tooling)
- \(C_{\text{compliance}} = \$0.5 - \$1\) million/year (Compliance & Auditing)
- \(C_{\text{support}} = \$1 - \$3\) million/year (Support)
Total Estimated Annual Operations (Platform Only, ROM): $11 - $26.5 Million / year
Marginal Cost Analysis per User
The 5M MAU target is an illustrative milestone used for these initial ROM estimates, not the ultimate goal for the platform, which is to support hundreds of millions or billions of users. At this initial scale, you can analyze the cost on a per-user basis.
- Average Cost Range Per User (at 5M MAU):
- Based on the total annual operational cost range of $11M - $26.5M, the average cost per user is: \[ \frac{\$11,000,000 \text{ to } \$26,500,000}{5{,}000{,}000 \text{ users}} = \mathbf{\$2.20 \text{ to } \$5.30 \text{ per user per year}} \]
- Marginal Cost Per Additional User:
- As a large-scale software platform, a system for a decentralized framework for drug assessment has high fixed costs (infrastructure, core engineering) but very low variable costs. Therefore, the marginal cost of supporting one additional user is expected to be a small fraction of the average cost, likely pennies per year. This cost will decrease further as the platform achieves greater economies of scale, making the system exceptionally efficient at supporting a global user base.
(Note: The underlying cloud infrastructure cost ($5M-$15M/year) is a top-down ROM estimate. A more granular, bottom-up analysis based on projected per-user storage, data transfer, and compute would provide further support for these figures and is a key area for future refinement of this model.)
*Note on Participant Financial Contributions and NIH Cost Discounts (Alignment with “Right to Trial & FDA Upgrade Act”):
This cost estimate covers building the technology, not paying patients for trial participation. The “Right to Trial & FDA Upgrade Act” (SEC. 303 and SEC. 304) works like this: 1. Sponsor Sets Costs: Sponsors list what it costs for a patient to join their trial (SEC. 304(a)). 2. NIH Covers Part: The NIH Trial Participation Cost Discount Fund pays part of these costs. An NIH algorithm picks the percentage to maximize QALYs and health benefits (SEC. 303(b, c)). At first, while building the algorithm and collecting data, use a simple default (like NIH pays 50%). Subsidies start flowing immediately, then get smarter over time. 3. Patient Pays the Rest: The patient pays what’s left after the NIH discount (SEC. 304(b)). 4. Platform Shows Everything: The platform for a dFDA displays all costs, the NIH discount, and what the patient owes (SEC. 204(c)(3)). The platform manages this information but doesn’t move money around, the NIH does that.
Large-scale figures sometimes discussed for “participant support” or “subsidies” would primarily reflect the total budget and impact of the NIH Trial Participation Cost Discount Fund, not operational outlays by the infrastructure for such a framework for direct compensation (which is not part of this model).
This estimate excludes costs for running the DAO governance structure and developing/maintaining plugins (though plugin development could be incentivized via bounties as per the Act).
Enhanced ROM Estimates and Cost Optimization
Disclaimer: This subsection presents ROM estimates incorporating the full technical requirements from the “Right to Trial & FDA Upgrade Act” using cost-saving strategies. The estimates assume successful open-source development, bounty programs, and AI automation.
Key Cost-Saving Strategies
- Open-Source Development: Global developer contributions under permissive licenses (Apache 2.0/MIT).
- Bounty Programs: Targeted bounties for features, security audits, and integrations.
- AI-Automated Development: AI coding assistants and automated testing to cut development time and costs.
- Modular Architecture: Parallel development of components by different teams/contributors.
- Existing Open-Source Components: Building on and contributing to existing healthcare/blockchain projects.
ROM Estimates by Technical Component
Blockchain Supply-Chain Ledger
- Components: Zero-knowledge proof implementation, DSCSA integration, IoT device integration
- Cost Reduction: Open-source blockchain frameworks, community bounties for core components
- Estimated ROM: 2M USD upfront / 0.5M USD annual maintenance
Patient Portal & Treatment Ranking System
- Components: Real-time ranking algorithm, outcome labels, mobile/SMS/IoT interfaces
- Cost Reduction: Open-source frontend frameworks, community-developed plugins
- Estimated ROM: 1.5M USD upfront / 0.3M USD annual maintenance
- Interoperability & API Infrastructure
- Components: FHIR-R5 server, EHR integration adapters, OAuth 2.0 implementation
- Cost Reduction: Existing open-source healthcare APIs, community-contributed adapters
- Estimated ROM: 1M USD upfront / 0.2M USD annual maintenance
- Security & Compliance
- Components: FedRAMP-Moderate compliance, annual pen testing, security monitoring
- Cost Reduction: Bug bounty program, automated security scanning
- Estimated ROM: 0.5M USD upfront / 0.5M USD annual
- AI/ML Capabilities
- Components: Protocol validation, patient-trial matching, safety signal detection
- Cost Reduction: Open-source ML models, transfer learning, community datasets
- Estimated ROM: 1M USD upfront / 0.3M USD annual
- Developer & Community Infrastructure
- Components: Documentation, SDKs, CI/CD pipelines, community support
- Cost Reduction: Automated documentation generation, community moderation
- Estimated ROM: 0.5M USD upfront / 0.2M USD annual maintenance
- Governance & Transparency
- Components: Technical Steering Committee operations, public metrics dashboards
- Cost Reduction: Automated reporting, community governance tools
- Estimated ROM: 0.2M USD upfront / 0.1M USD annual
Total Estimated Development (Upfront): 6.7M USD Total Estimated Annual Operations: 2.1M USD
Cost Optimization Strategies and Risk Mitigation
Bounty Program Implementation
- $1M annual budget for security bounties and feature development
- Structured as graduated rewards based on impact and complexity
- Community-voted prioritization of bounty targets
Open-Source Community Building
- Developer documentation and starter kits ($0.2M initial)
- Hackathons and community events ($0.3M annual)
- Contributor recognition program ($0.1M annual)
AI-Assisted Development
- AI code generation and review tools ($0.5M initial setup)
- Automated testing and validation pipelines ($0.3M annual)
- Continuous training of domain-specific models ($0.2M annual)
Risk Mitigation
- 20% contingency buffer on all estimates
- Phased rollout with clear milestones
- Regular third-party security audits
Total Estimated ROM with Optimization:
- Upfront (Year 1): $8.5M (including contingency)
- Annual Operations (Years 2+): $3.0M (including bounties and community programs)
Note: These estimates assume you use open-source code, get volunteers to help, and let AI do most of the work. This only works if enough people actually contribute and you run the bounty/prize programs well.
Scenario Based ROM Estimates for Broader Initiative Costs
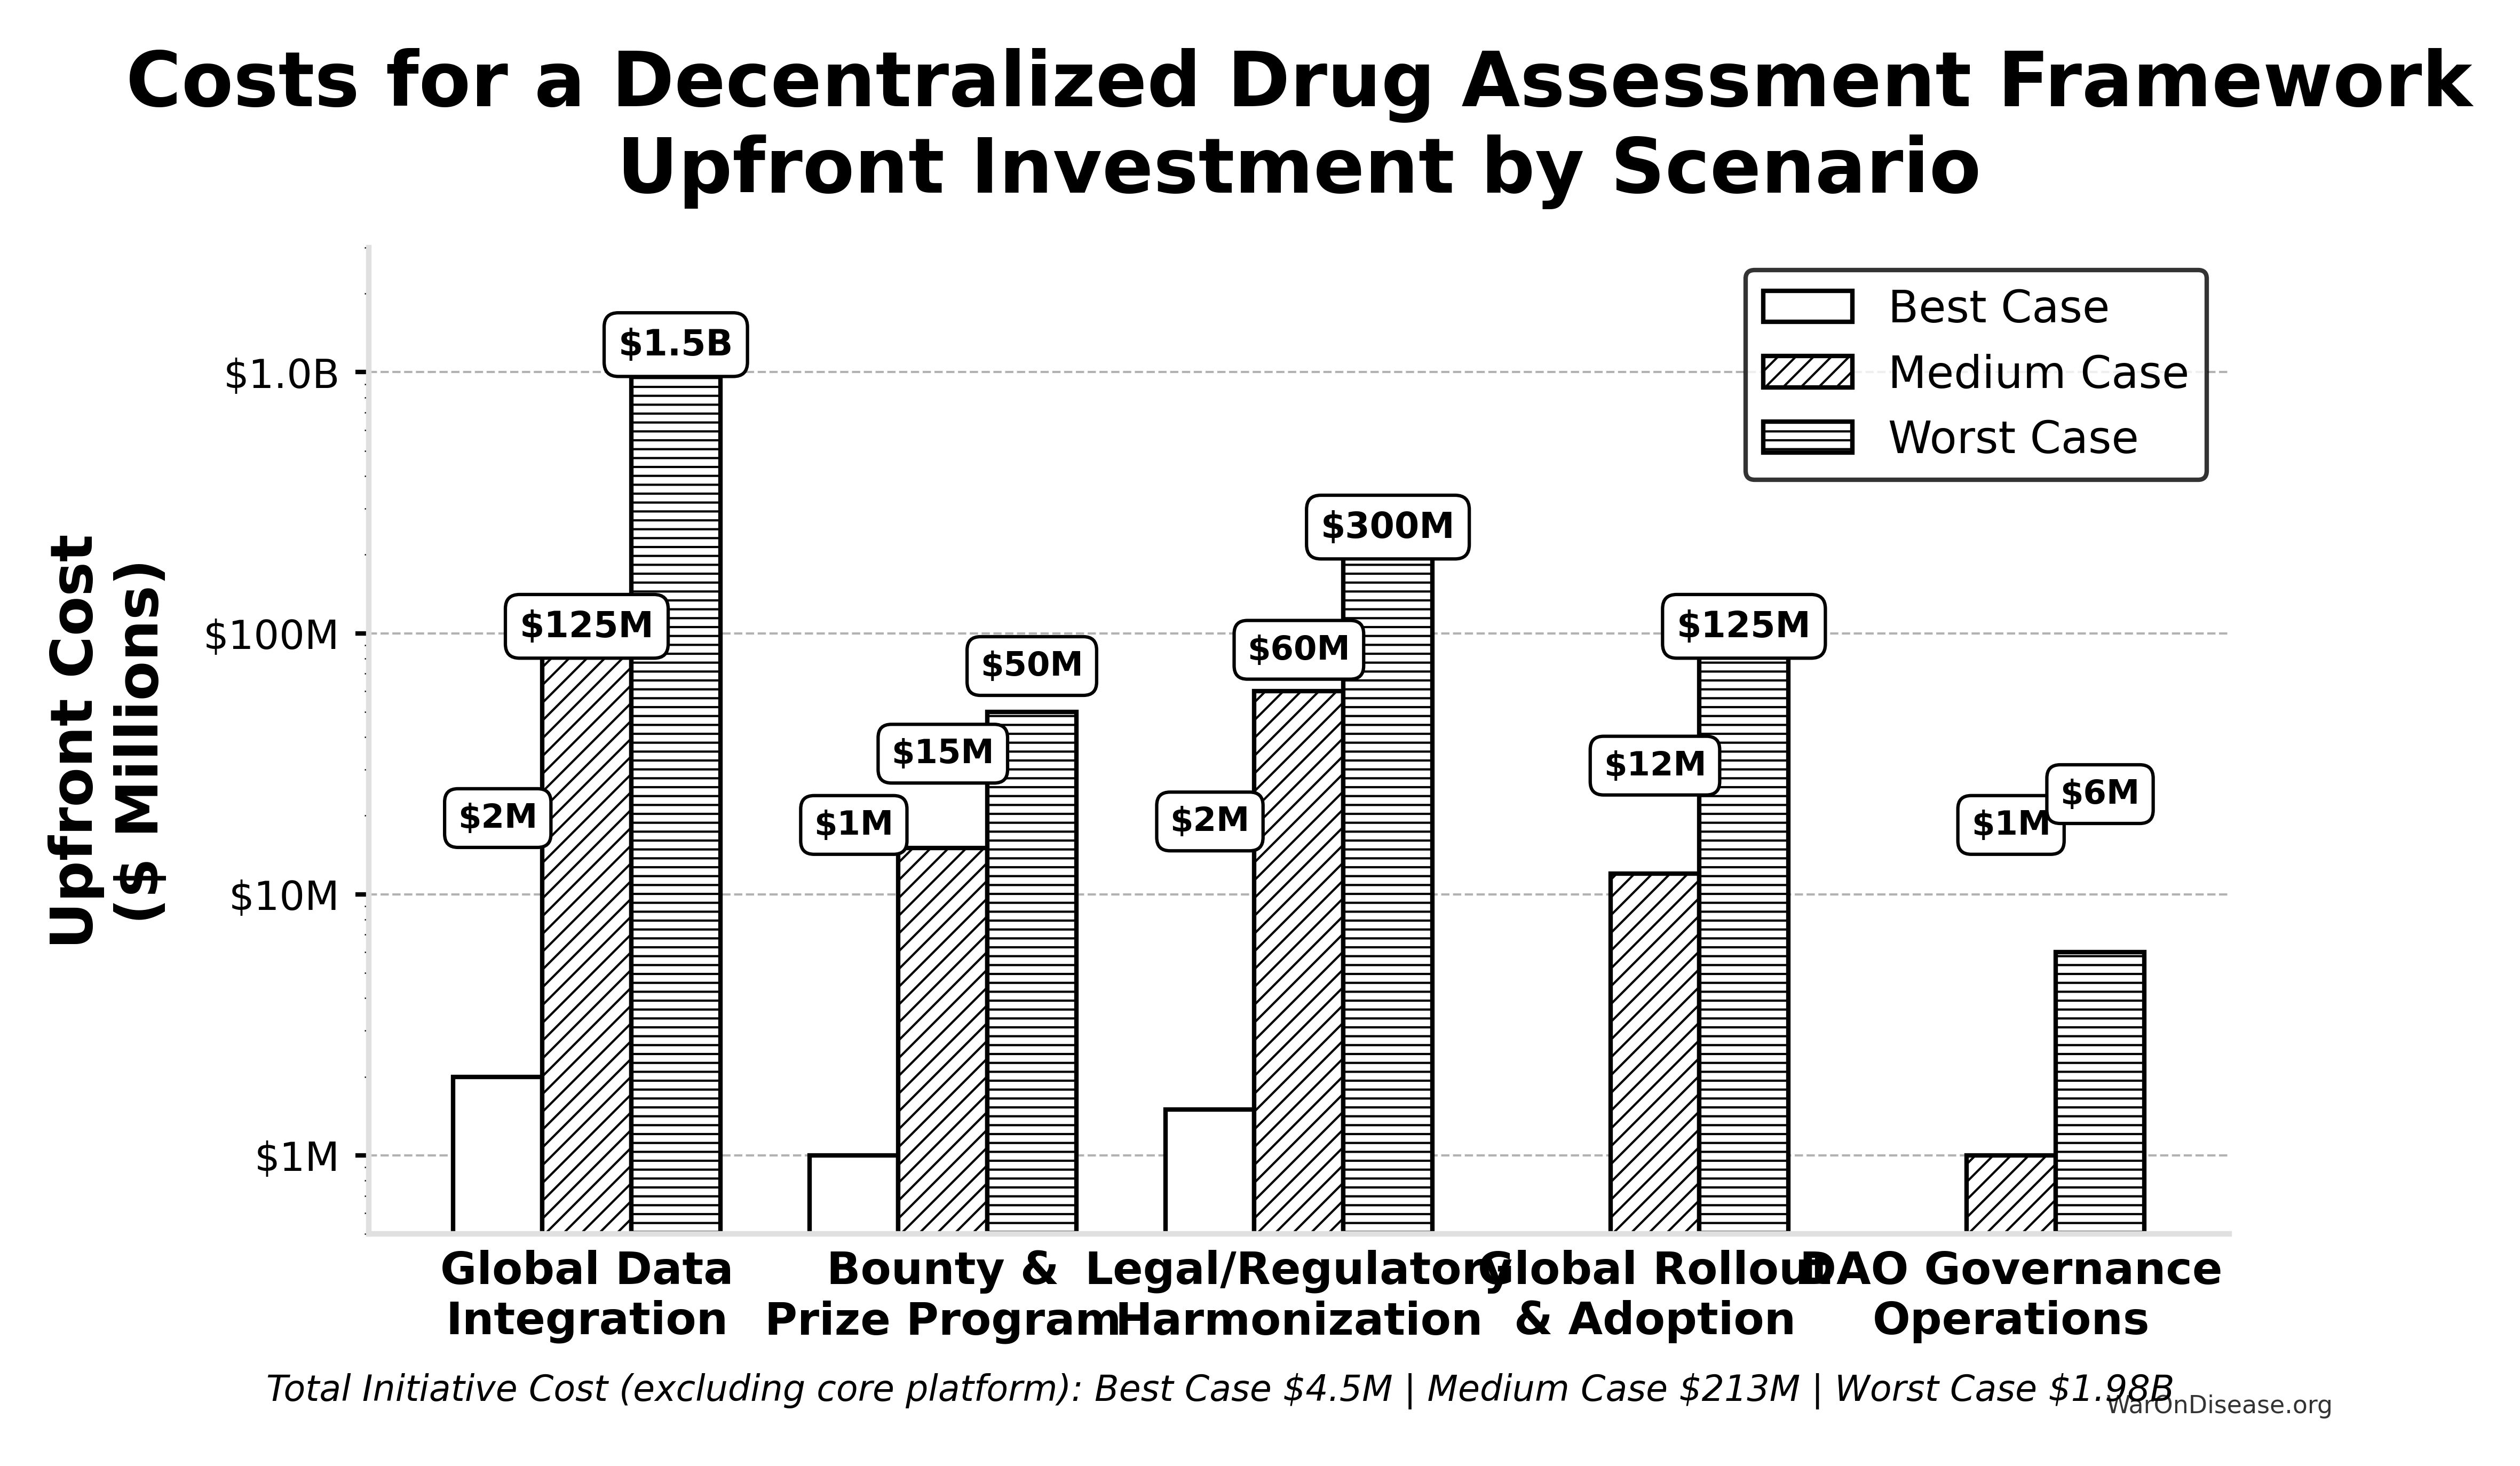
This table presents point estimates for each scenario, with the overall range of possibilities captured by comparing the Best, Medium, and Worst Case columns.
| Component | Best Case (Upfront / Annual) | Medium Case (Upfront / Annual) | Worst Case (Upfront / Annual) | Key Assumptions & Variables Driving Range |
|---|---|---|---|---|
| Global Data Integration | $2M / ~$0 | $125M / $10M | $1.5B / $150M | Success of AI/automation, standards adoption, #systems, vendor cooperation. |
| Bounty & Prize Program (Act SEC. 204(i)) | $1M (Prizes) / ~$0 | $15M (Bounties) / $2M | $50M (Major Bounties) / $10M | Success of organic ecosystem growth vs. need to incentivize critical plugin/tool development via bounties. |
| Legal/Regulatory Harmonization | $1.5M / ~$0 | $60M / $3M | $300M / $30M | Effectiveness of AI legal tools, political will, complexity of global law. |
| Global Rollout & Adoption | ~$0 / ~$0 | $12M / $3M | $125M / $30M | Need for training/support beyond platform status, user interface complexity. |
| DAO Governance Operations | ~$0 / ~$0 | ~$1M / $0.3M | ~$6M / $1M | Automation level, need for audits, grants, core support staff. |
| — TOTAL — | ~$4.5M / ~$0 | ~$213M / ~$18.3M | ~$1.98B+ / ~$221M+ | Represents total initiative cost excluding core platform build/ops. |
Interpretation
Even when pursuing efficient strategies, the potential cost for the full initiative for a decentralized framework (beyond the core platform) varies dramatically based on real-world execution challenges. The Medium Case suggests upfront costs in the low hundreds of millions and annual costs in the low tens of millions, while the Worst Case pushes towards multi-billion dollar upfront figures and annual costs in the hundreds of millions, dominated by integration, plugin funding, and legal costs if automation and community efforts fall short.
Revised Summary
Based on the detailed technical specification, a ROM estimate suggests:
- Initial Core Platform Build (~2.5 years): ~$37.5 - $46M
- Annual Core Platform Operations (at ~5M MAU scale): ~$11 - $26.5 Million (These platform operational costs are distinct from the financial flows of patient contributions and the NIH Trial Participation Cost Discount Fund, and also exclude plugin ecosystem costs not covered by platform bounties)
This revised, bottom-up ROM highlights that while the core technology platform build might be achievable within tens of millions, the previously estimated billions likely reflect the total cost of the entire global initiative. This includes massive integration efforts, legal frameworks, global rollout, and the financial ecosystem involving participant contributions and the direct NIH-funded discounts to patient costs, rather than direct platform-disbursed compensation. This conclusion is further supported by the top-down analogous estimate derived from market comparables, which points to a total initiative investment in the range of $50 million to $500M for a commercial-grade equivalent.
Benefit Analysis - Quantifying the Savings
This section quantifies the potential societal benefits of an infrastructure for a decentralized framework for drug assessment, focusing primarily on R&D cost savings and health outcome improvements.
Market Size and Impact
The global pharmaceutical and medical device R&D market is vast. Annual global spending on pragmatic clinical trials alone was estimated to be in the range of USD 60-80 billion in 2024, and projected to exceed USD 100 billion by the early 2030s. Most of this can be done cheaper with a decentralized framework for drug assessment. If such a framework captures even a fraction of this market by being faster and cheaper, its economic impact will be huge.
This analysis uses a conservative baseline estimate of $100.0B per year in global clinical trial spending that is potentially addressable by a decentralized framework through decentralization, automation, and real-world data integration. This figure accounts for future market growth and the expanding scope of trials that could benefit from the methodologies of a decentralized framework.
- Current Average Costs: Various estimates suggest $1.0 - $2.5 billion to bring a new drug from discovery through FDA approval, spread across ~10 years.
- Clinical Trial Phase Breakdown:
- Phase I: $2 - $5 million/trial (smaller scale).
- Phase II: $10 - $50 million/trial (depending on disease area).
- Phase III: $100 - $500M/trial (large patient populations).
- Per-Patient Phase III Costs: Often $40,000 - $120,000+ per patient (site fees, overhead, staff, monitoring, data management).
Decentralized Trial Costs Modeled on Oxford RECOVERY
Oxford RECOVERY: Achieved ~$500 per patient. Key strategies included:
- Embedding trial protocols within routine hospital care.
- Minimizing overhead by leveraging existing staff/resources and electronic data capture.
- Focused, pragmatic trial designs.
Extrapolation to New System:
- A well-integrated global platform could approach $500 - $1K per patient in many cases, especially for pragmatic or observational designs.
- Up to ~80-100x+ cost reduction cited for RECOVERY vs. typical Phase III trials is an aspirational benchmark, derived by comparing per-patient costs of ~$500-$1,000 against traditional costs of ~$40,000 - $120,000+.
The cost reduction factor can be formalized as:
\[ \text{Reduction Factor} = \frac{c_t}{c_d} = \frac{\$40,000 - \$120,000}{\$500 - \$1,000} \approx 40 - 240\times \]
Where:
- \(c_t\) is the traditional cost per patient
- \(c_d\) is the decentralized cost per patient
The percentage reduction is:
\[ \alpha = 1 - \frac{c_d}{c_t} = 1 - \frac{\$500 - \$1,000}{\$40,000 - \$120,000} \approx 97.5\% - 99.2\% \]
Overall Savings
By Reducing Per-Patient Costs
- If a trial with 5,000 participants costs $500 - $1K/patient, total cost is $2.5 - $5 million, versus $200 - $600 million under traditional models.
- This magnitude of savings can drastically reduce the total cost of clinical development.
For a trial with \(x\) participants, the total cost savings is:
\[ S_{\text{trial}}(x) = (c_t - c_d) \cdot x \]
Where:
- \(c_t\) is the traditional cost per patient ($40,000 - $120,000)
- \(c_d\) is the decentralized cost per patient ($500 - $1,000)
For a trial with \(x = 5,000\) participants, the savings range from:
- Minimum savings: \((\$40,000 - \$1,000) \times 5,000 = \$195\) million
- Maximum savings: \((\$120,000 - \$500) \times 5,000 = \$597.5\) million (using the RECOVERY per-patient baseline of $500)
This yields a savings range of approximately $195 - $598 million per trial.
Volume of Trials & Speed
- Faster, cheaper trials allow more drug candidates, off-label uses, nutraceuticals, and personalized dosing strategies to be tested.
- Shorter development cycles reduce carrying costs and risk, further increasing ROI for sponsors.
- Crowdsourced funding mechanisms, like those established by your decentralized institutes of health, can further reduce patient costs and direct resources to high-value pragmatic clinical trials.
Regulatory Savings
- A single integrated platform with automated data audits cuts bureaucratic duplication across multiple countries, drastically lowering compliance costs.
Accelerated Adoption through Legislative Mandates
- Provisions such as a “Right to Trial,” as outlined in the “Right to Trial and FDA Upgrade Act”, would significantly accelerate the adoption and utilization of an infrastructure for a decentralized framework. By guaranteeing patient access to trials via the platform, data generation, network effects, and the realization of cost savings would be expedited, further enhancing the overall benefits projected in this analysis.
Increased Competition Among Sponsors Leading to Lower Submitted Trial Costs
- The transparent nature of such a framework’s infrastructure, coupled with mechanisms like NIH discount allocations based on value (QALYs per dollar as described in the “Right to Trial & FDA Upgrade Act”), is expected to create a competitive environment. Sponsors will be incentivized to submit the most efficient trial designs and leanest operational costs to the platform to attract NIH support and patient participation, further driving down the overall R&D expenditure beyond just the technical efficiencies of decentralized trials themselves.
Drug Price Reductions from Global Competition and Importation
U.S.-Specific
- U.S. prescription drug prices are 50–90% higher than in peer countries.
- Allowing importation and global competition could conservatively reduce U.S. drug spending by 20–50% for affected drugs.
- Example Calculation: U.S. annual prescription drug spending is ~$360B. If 50% of the market is affected and prices drop by 25%, annual savings = $360B × 0.5 × 0.25 = $45B.
The drug price reduction savings can be formalized as:
\[ S_{\text{drug}} = P_{\text{US}} \times f_{\text{affected}} \times \Delta p \]
Where:
- \(P_{\text{US}} = \$360\) billion is the annual U.S. prescription drug spending
- \(f_{\text{affected}} \in [0,1]\) is the fraction of the market affected by importation/competition
- \(\Delta p \in [0,1]\) is the percentage price reduction for affected drugs
For the example:
\[ S_{\text{drug}} = \$360\text{B} \times 0.5 \times 0.25 = \$45\text{B} \text{ annually} \]
Beyond direct importation effects, the fundamental efficiencies introduced by a decentralized framework for drug assessment, drastically reduced R&D costs and accelerated development timelines, are anticipated to further enhance overall market competition for medicines. By lowering the barriers to entry for bringing novel therapies, as well as generics and biosimilars, to market, such a framework can foster a richer landscape of therapeutic alternatives. A greater number of competing products for similar indications is a well-established economic driver for lower final drug prices, benefiting payors and patients alike. While quantifying this specific effect on end-user drug prices is complex and multifactorial, the structural changes proposed by such a framework strongly support a trend towards increased affordability through enhanced market competition.
Prevention Savings from Increased Preventive Care
U.S.-Specific
- Chronic diseases account for ~90% of U.S. healthcare spending .
- Preventive care is underfunded (~5% of spend); every $1 spent on prevention saves ~$3.
- Doubling effective preventive spending could yield hundreds of billions in annual savings.
- Example Calculation: If preventive spending increases by $205B and each $1 saves $3, additional savings = $205B × 3 = $615B/year.
The prevention savings can be formalized as:
\[ S_{\text{prevention}} = \Delta P \times r_{\text{savings}} \]
Where:
- \(\Delta P\) is the additional spending on preventive care
- \(r_{\text{savings}}\) is the savings ratio (e.g., $3 saved per $1 spent)
For the example:
\[ S_{\text{prevention}} = \$205\text{B} \times 3 = \$615\text{B} \text{ annually} \]
Economic Value of Earlier Access to Treatments VSL QALY
- Faster approvals and access to effective treatments can save lives and improve quality of life.
- Value of a Statistical Life (VSL): U.S. agencies use ~$10M per life saved.
- QALY Framework: Standard willingness-to-pay is $100,000–$150K per QALY gained.
- Example Calculation: If faster access saves 10,000 QALYs/year, annual benefit = 10,000 × $150K = $1.5B. If 10,000 lives are saved, benefit = 10,000 × $10M = $100B.
- These benefits are additive to direct cost savings and can be substantial depending on the scale of acceleration.
Post-Safety Efficacy Lag Elimination
A primary health benefit of a decentralized framework for drug assessment comes from eliminating the “efficacy lag”, the 8.2-year Phase II/III delay between Phase I safety verification and final approval. Critical: This does NOT eliminate safety testing. Phase I safety testing (2.3 years) is preserved.
The Efficacy Lag Problem
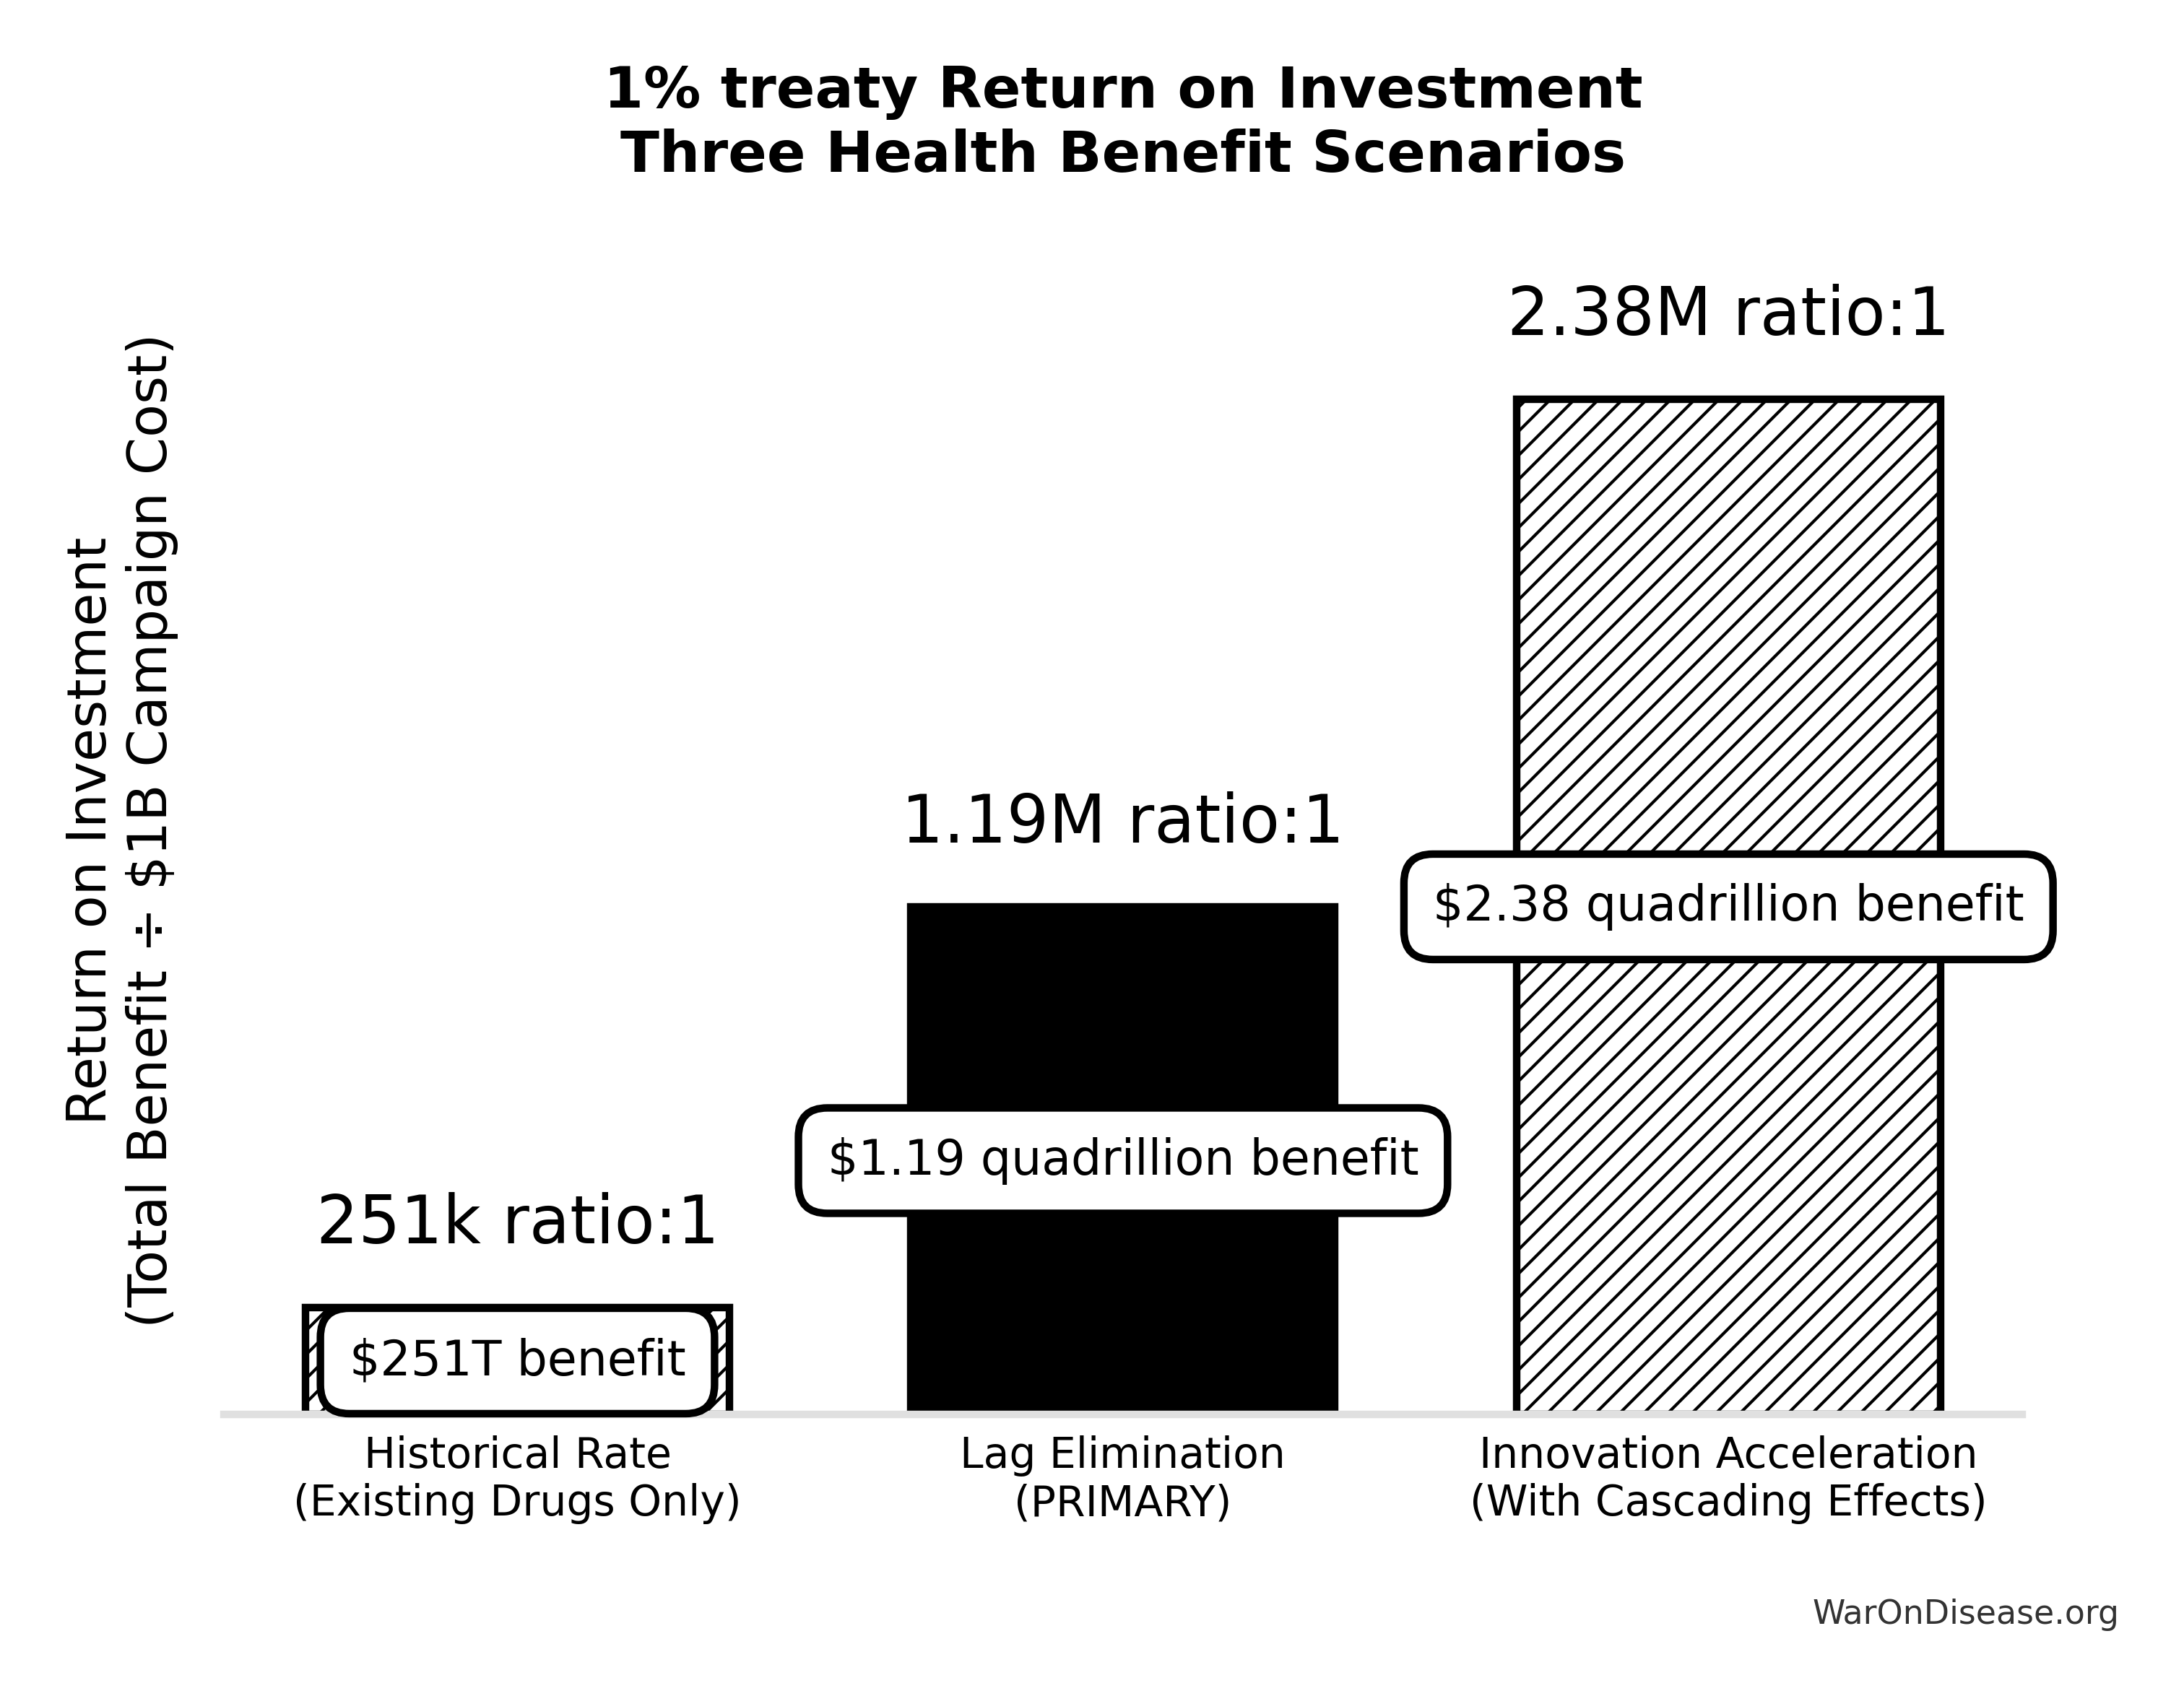
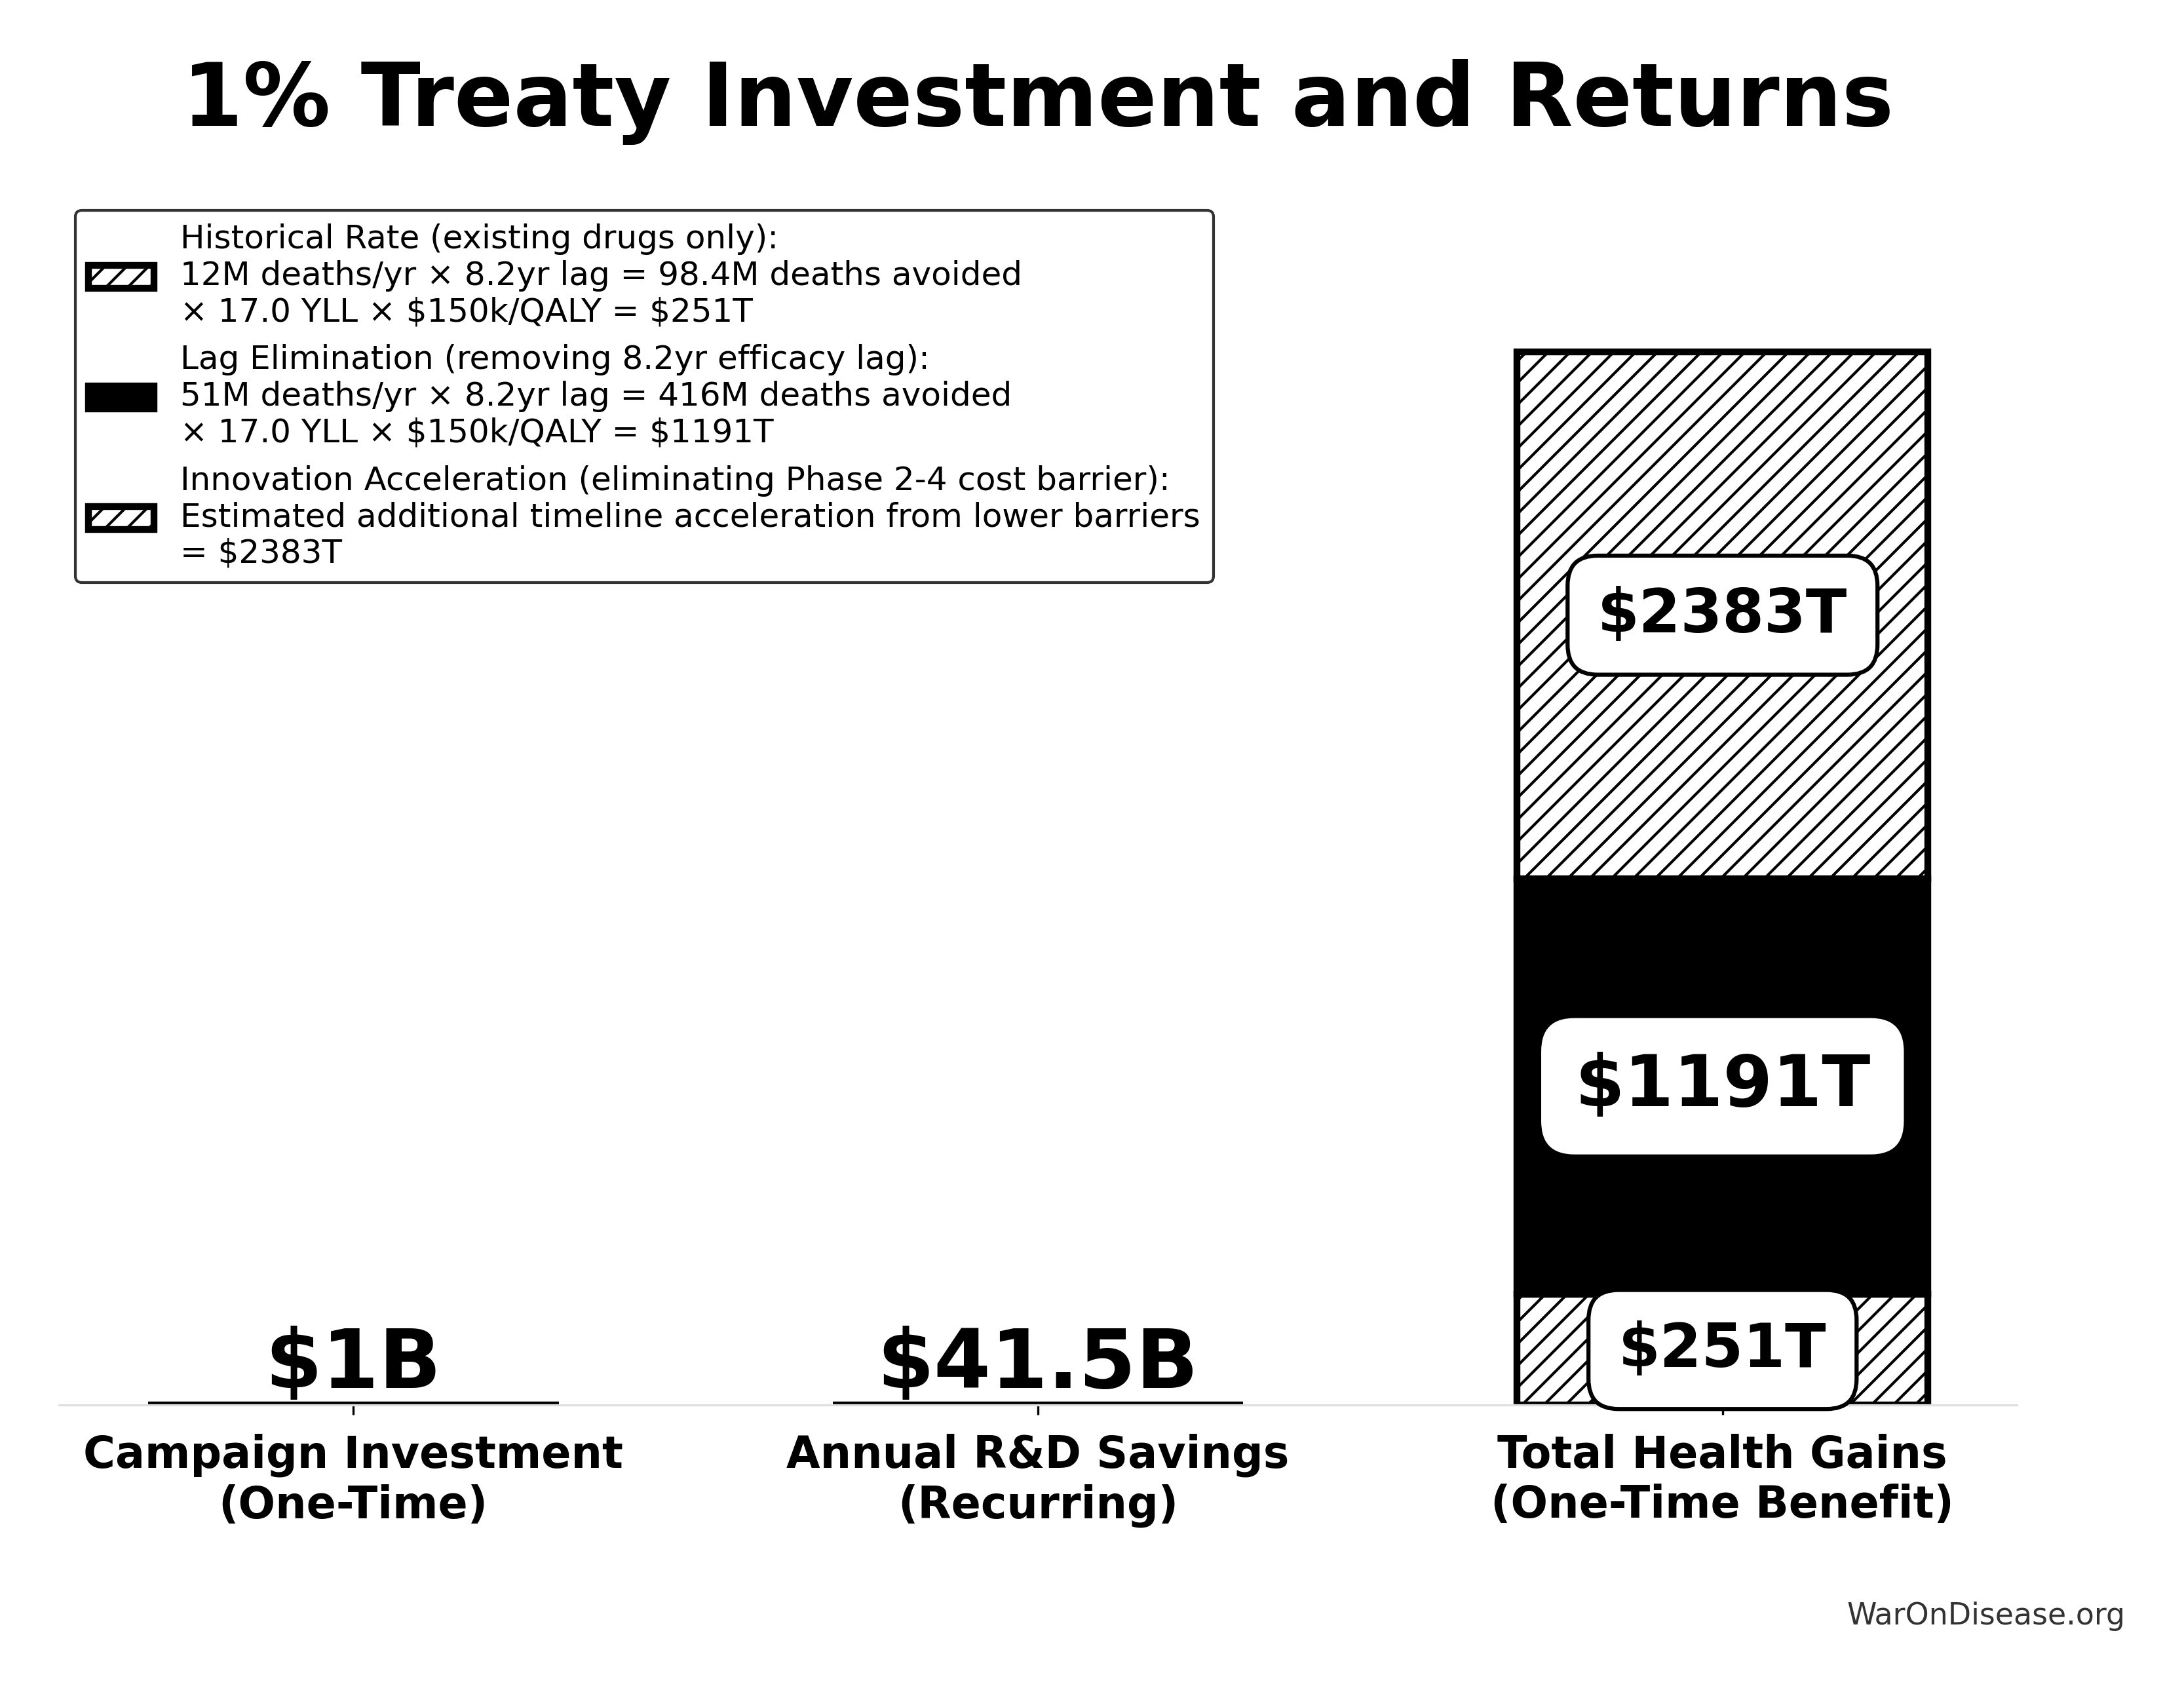
A comprehensive quantitative analysis of post-safety efficacy lag costs (1962-2024) found:
- Total Deaths: 416M preventable deaths over 8.2-year efficacy lag (1962-2024)
- Total DALYs: 7.94B Disability-Adjusted Life Years lost
- Total Timeline Shift: One-time 8.2-year acceleration in disease eradication
The analysis shows that for every 1 unit of harm the FDA prevents through safety testing, it generates 3.07k units of harm through efficacy delay (Type II vs. Type I error ratio).
How a Decentralized Framework Eliminates the Efficacy Lag
Such a framework provides provisional access post-Phase I via trial participation:
- Phase I Safety Testing: Maintained at 2.3 years (no change)
- Post-Phase I Access: Patients can access drugs through trial participation immediately after safety verification
- Continuous Efficacy Monitoring: Real-world evidence replaces the 8.2-year pre-market efficacy delay
This eliminates the post-safety efficacy lag (the Phase II/III portion, while preserving Phase I safety testing) by enabling real-world evidence collection during trials.
Quantified Benefits (One-Time Timeline Shift)
The elimination of the post-safety efficacy lag by such a framework achieves a one-time 8.2-year timeline acceleration:
- Total DALYs Averted: 7.94B (total one-time impact from 8.2-year timeline shift)
- Total Economic Value: $1.19 quadrillion (total one-time benefit from timeline shift)
- Deaths Prevented: 416M (total over the 8.2-year period)
This represents the top-down comprehensive estimate of the health benefits from a decentralized framework from eliminating the post-safety efficacy lag.
For detailed methodology and assumptions, see The Human Capital Cost of Regulatory Latency.
Gross R&D Savings from Implementing a Decentralized Framework
- Parameter: Percentage reduction in addressable clinical trial costs due to a decentralized framework for drug assessment.
- Source/Rationale:
- Decentralized Clinical Trials (DCTs) have demonstrated potential for significant cost reductions (20-50.0% or more) through reduced site management, travel, and streamlined data collection.
- The UK RECOVERY trial achieved cost reductions of ~80-98% per patient compared to traditional trials.
- Note on R&D Savings Estimates: While specific trials like RECOVERY showcase transformative cost-saving potential (>95%), the average quantifiable cost reduction across the full spectrum of decentralized trials is an area of ongoing research and varies significantly based on trial complexity, therapeutic area, and the extent of decentralization. The scenarios below therefore present a range, with the “Transformative” scenario reflecting exceptional, RECOVERY-like outcomes.
The annual gross R&D savings can be calculated as:
\[ S_{\text{annual}} = \alpha \cdot R_d \]
Where:
\(\alpha \in [0,1]\) is the fraction of R&D cost reduction (percentage reduction divided by 100)
\(R_d = \$100.0\) billion is the annual global clinical trial spending addressable by such a framework
Range Used in Sensitivity Analysis:
- Conservative: \(\alpha = 0.30\) \[ S_{\text{annual}} = 0.30 \times \$100.0\text{B} = \$30.0\text{B} \text{ annually} \]
- Base Case: \(\alpha = 0.50\) \[ Benefit_{gross,ann} = Trials_{ann} \times Reduction = \$83.00B \times 50.0\% = \$41.50B \]
- Optimistic: \(\alpha = 0.70\) \[ S_{\text{annual}} = 0.70 \times \$100.0\text{B} = \$70\text{B} \text{ annually} \]
- Transformative (RECOVERY Trial-like): \(\alpha = 0.95\) \[ S_{\text{annual}} = 0.95 \times \$100.0\text{B} = \$95\text{B} \text{ annually} \]
For detailed source citations, see
ROI Analysis for a Decentralized Framework
The return on investment for an infrastructure supporting a decentralized framework for drug assessment is exceptionally high because it’s global software infrastructure with massive reach. Unlike investments in single drugs or therapies, an investment in such an infrastructure creates systemic efficiencies that benefit all R&D. The primary economic benefit is the drastic reduction in clinical trial operational costs, which can be redeployed to fund more research.
Methodology
Compare Baseline to Future State:
- Baseline: 30–40 new drugs approved annually in the U.S., each costing $1 - $2.5 billion on average for full development and approval. Total R&D spending (industry-wide) is on the order of $90 - $100+ billion per year globally.
- Future State: Potentially hundreds (even thousands) of continuous trials, each at a fraction of the cost. This could double or triple the number of new approvals/indications tested each year and expand to off-patent/unpatented therapies that are currently underexplored.
Model Inputs
Upfront Cost (Core Platform Build): Based on the ROM estimate of ~$37.5 - $46M detailed in Upfront (Capital) Expenditure. ROI calculations use a representative figure (e.g., $40M).
Annual Operational Cost (Core Platform): Based on the ROM estimate of ~$11 - $26.5 Million / year detailed in Annual Operational Costs.
Annual Broader Initiative Costs: These can vary significantly, from near zero in optimistic scenarios to tens or hundreds of millions annually. The ROI analysis will consider scenarios, including a “Lean Ecosystem” that combines core platform operational costs with the Medium Case annual broader initiative costs (~$21.3 Million / year) from Scenario-Based ROM Estimates for Broader Initiative Costs. (Note: The ROI analysis will primarily focus on these ROM-derived costs. Previous high-level conceptual estimates for a fully scaled, long-term global vision for a decentralized framework, which were significantly larger, are superseded by these more granular figures from the Costs for a Decentralized Framework - ROM Estimates (Partnership Model) section for the purpose of this ROI calculation.)
Cost Reduction: Up to 80× in the biggest, most efficient scenarios; conservative average ~50.0%–80% reduction in trial costs.
Increased Throughput: 2×–5× more trials and potentially many more candidates tested in parallel.
Faster to Market: Potentially 1–3 years shaved off a typical 7–10 year development cycle, yielding earlier revenue generation and extended effective patent life for sponsors.
Simplified ROI Scenario
Initial Note on Operational Costs in this ROI Scenario: The following ROI calculation primarily uses cost figures derived from the detailed ROM estimates in Costs for a Decentralized Framework - ROM Estimates (Partnership Model). This includes the core platform build and operational costs, as well as scenarios for broader initiative costs. This approach provides a more grounded basis for the ROI than previous high-level conceptual figures for a fully scaled global ecosystem.
- Industry R&D Spend (Baseline): $100.0B/year globally (approx.).
- Potential Savings: 50.0% reduction implies $50.0B/year saved if the entire industry migrated.
- Platform Cost Scenarios (Derived from ROM Estimates):
- Upfront Cost (Core Platform Build): ~$40M (representative figure from Upfront (Capital) Expenditure).
- Annual Operational Cost Scenarios:
Scenario 1: Core Platform Only: ~$11 - $26.5 Million / year (from Annual Operational Costs).
Let’s use a midpoint of ~$19 Million/year for calculation.
Scenario 2: Lean Ecosystem (Core Platform + Medium Broader Initiatives):
- Core Platform Ops (midpoint from Annual Operational Costs): ~$19 Million/year
- Medium Broader Initiative Annual Costs (from Scenario-Based ROM Estimates): ~$21 Million/year
- Total Lean Ecosystem Annual Cost: ~$18.9M + ~$21.1M = ~$40M/year (or $0.04 Billion/year).
This aligns with the cost basis for the ROI cited in the Executive Summary.
(Sensitivity analysis could include “Worst Case” broader initiative costs from Scenario-Based ROM Estimates, but this would significantly increase annual costs.)
- Net Annual Savings (assuming full adoption and 50.0% R and D cost reduction): $41.5B/year.
From a purely financial perspective, if the industry can move to such a platform and achieve these savings:
\[ \text{ROI} = \frac{\text{Net Annual Savings}}{\text{Annualized Platform Cost}} \]
Here’s how you calculate the ROI based on the Lean Ecosystem scenario:
The total annualized cost combines upfront costs (amortized) and ongoing operational costs:
\[ C_{\text{annualized}} = \frac{C_0}{n} + C_{\text{op}} \]
Where:
- \(C_0 = \$40\) million is the upfront cost (Core Platform Build)
- \(n = 5\) years is the amortization period
- \(C_{\text{op}} = \$40\) million/year is the annual operational cost (Lean Ecosystem)
For the Lean Ecosystem scenario:
Upfront Cost (Core Platform Build from Upfront (Capital) Expenditure): $40M
Amortized over 5 years: \[ \frac{\$40\text{M}}{5} = \$8 \text{ Million/year} \]
Annual Operational Cost (Lean Ecosystem - Core Platform Ops from Annual Operational Costs + Medium Broader Initiatives from Scenario-Based ROM Estimates): ~$40M/year
Total Annualized Cost: \[ C_{\text{annualized}} = \$8\text{M} + \$40\text{M} = \$48 \text{ Million/year} \]
(or \(0.048\) Billion/year)
This simplified calculation, based on a basic amortization of upfront costs, yields an exceptionally high ROI. However, a more rigorous Net Present Value (NPV) analysis, which properly discounts future costs and savings, is detailed in Calculation Framework.
The NPV analysis provides the final estimated ROI of approximately 451:1, which is the figure cited throughout this document.
Full Range ROI Sensitivity Analysis
To provide a comprehensive view, you can calculate the ROI across the full spectrum of cost possibilities by combining the Core Platform costs with the Broader Initiative scenarios from Costs for a Decentralized Framework - ROM Estimates (Partnership Model).
Assumptions for Full Range ROI Calculation
- Net Annual Savings: $50.0B/year (from 50.0% R&D cost reduction).
- Amortization Period for Upfront Costs: 5 years.
1. Lowest Total Cost Scenario (Best Case Core Platform + Best Case Broader Initiatives)
Upfront Costs:
- Core Platform Build (Low end from Upfront (Capital) Expenditure): ~$37.5 Million
- Broader Initiatives (Best Case Upfront from Scenario-Based ROM Estimates): ~$4.5 Million
- Total Lowest Upfront Cost: $37.5M + $4.5M = $42 Million
- Amortized over 5 years: $42M / 5 = $8.4 Million/year
Annual Operational Costs:
- Core Platform Operations (Low end from Annual Operational Costs): ~$11 Million/year
- Broader Initiatives (Best Case Annual from Scenario-Based ROM Estimates): ~$0 Million/year
- Total Lowest Annual Operational Cost: $11 Million/year
Total Lowest Annualized Cost: \[ C_{\text{annualized}}^{\text{low}} = \frac{C_0^{\text{low}}}{n} + C_{\text{op}}^{\text{low}} = \frac{\$42\text{M}}{5} + \$11\text{M} = \$19.4 \text{ Million/year} \]
ROI (Lowest Cost Scenario): \[ \text{ROI}^{\text{low}} = \frac{S_{\text{annual}}}{C_{\text{annualized}}^{\text{low}}} = \frac{\$50.0\text{B}}{\$0.0194\text{B}} \approx 2577:1 \]
2. Highest Total Cost Scenario (Worst Case Core Platform + Worst Case Broader Initiatives)
Upfront Costs:
- Core Platform Build (High end from Upfront (Capital) Expenditure): ~$46M
- Broader Initiatives (Worst Case Upfront from Scenario-Based ROM Estimates): ~$2.231 Billion
- Total Highest Upfront Cost: $46M + $2.231B = ~$2.277 Billion
- Amortized over 5 years: $2.277B / 5 = ~$455.4 Million/year
Annual Operational Costs:
- Core Platform Operations (High end from Annual Operational Costs): ~$26.5 Million/year
- Broader Initiatives (Worst Case Annual from Scenario-Based ROM Estimates): ~$271 Million/year
- Total Highest Annual Operational Cost: $26.5M + $271M = ~$297.5 Million/year
Total Highest Annualized Cost: \[ C_{\text{annualized}}^{\text{high}} = \frac{C_0^{\text{high}}}{n} + C_{\text{op}}^{\text{high}} = \frac{\$2.277\text{B}}{5} + \$297.5\text{M} = \$752.9 \text{ Million/year} \]
ROI (Highest Cost Scenario): \[ \text{ROI}^{\text{high}} = \frac{S_{\text{annual}}}{C_{\text{annualized}}^{\text{high}}} = \frac{\$50.0\text{B}}{\$0.7529\text{B}} \approx 66:1 \]
This full range sensitivity analysis demonstrates that the ROI for such an initiative remains exceptionally positive. Even at the highest conceivable costs derived from the Costs for a Decentralized Framework - ROM Estimates (Partnership Model) section, the financial return is substantial.
Broader Impacts on Medical Progress
Acceleration of Approvals
- With continuous, real-time data, new drugs, devices, and off-label uses could gain near-immediate or conditional approvals once efficacy thresholds are met.
- Diseases lacking major commercial interest (rare diseases, unpatentable treatments) benefit from much lower trial costs and simpler recruitment.
Personalized Medicine
- Aggregating genomic, lifestyle, and medical data at large scale would refine “one-size-fits-all” treatments into personalized regimens.
- Feedback loops allow patients and clinicians to see near-real-time outcome data for individuals with similar profiles.
Off-Label & Nutritional Research
- Many nutraceuticals and off-patent medications remain under-tested. Lower cost trials create economic incentives to rigorously evaluate them.
- Could lead to significant improvements in preventive and integrative healthcare.
Public Health Insights
- Constant real-world data ingestion helps identify population-level signals for drug safety, environmental exposures, and dietary patterns.
- Better evidence-based guidelines on how foods, supplements, or lifestyle interventions interact with prescribed medications.
Innovation & Competition
- Lower barriers to entry for biotech start-ups, universities, and non-profits to test new ideas.
- Potential for new revenue streams (e.g., analytics, licensing validated trial frameworks, etc.), leading to reinvestment in R&D.
Healthcare Equity
- Decentralized trials let anyone participate, anywhere. More diverse data, less bias.
- Opens up access to experimental treatments for everyone, not just the rich.
Data Sources and Methodological Notes
Cost of Current Drug Development:
ROI Calculation Method:
- Simplified approach comparing aggregated R&D spending to potential savings.
- Does not account for intangible factors (opportunity costs, IP complexities, time-value of money) beyond a basic Net Present Value (NPV) perspective.
Scale & Adoption Rates:
- The largest uncertainties revolve around uptake speed, regulatory harmonization, and participant willingness.
- Projections assume widespread adoption by major pharmaceutical companies and global health authorities.
Secondary Benefits:
- Quality-of-life improvements, lower healthcare costs from faster drug innovation, and potentially fewer adverse events from earlier detection.
- These are positive externalities that can significantly enlarge real ROI from a societal perspective.
Daily Opportunity Cost of Inaction
This section quantifies the daily societal cost of maintaining the status quo, framed as the opportunity cost of not implementing an infrastructure for a decentralized framework for drug assessment. By translating the annualized benefits identified in this analysis into a daily metric, you can better appreciate the urgency of the proposed transformation. The “cost of inaction” is the value of the health gains (QALYs) and financial savings (R&D efficiencies) that are forgone each day such a system is not operational.
Base Case: Daily Lost QALYs and Financial Savings
The calculations below are based on the central (“base case”) estimates established in the preceding sections of this analysis.
- Daily DALYs Lost:
- The analysis (Regulatory Mortality Analysis) projects a baseline of 7.94B Disability-Adjusted Life Years (DALYs) averted from eliminating the regulatory efficacy lag over the 8.2-year timeline shift.
- The daily opportunity cost in lost health is therefore: \[ \frac{74{,}148{,}065\ \text{QALYs}}{365\ \text{days}} \approx \mathbf{203,145\ \text{QALYs lost per day}} \]
- Daily Financial Value Lost:
- The analysis (Gross R and D Savings from dFDA Implementation) projects gross R&D savings of $50.0B per year by reducing the costs of the $100.0B global clinical trial market by 50.0%. This represents value that is currently being spent inefficiently.
- The daily financial loss from this inefficiency is: \[ \frac{\$50{,}000{,}000{,}000}{365\ \text{days}} \approx \mathbf{\$137\ \text{million lost per day}} \]
Discussion of Uncertainty and Key Variables
The total one-time benefit from eliminating the efficacy lag depends on several key variables:
Adoption Rate: The calculations above implicitly assume full adoption. As modeled in the NPV analysis in the ROI Analysis section, adoption will be gradual, with benefits ramping up over time as the platform becomes standard.
Magnitude of R&D Savings: The percentage reduction in R&D costs is a critical variable. While the 95% reduction seen in the RECOVERY trial demonstrates what is possible, the system-wide average may be lower. The sensitivity table addresses this by showing a range from 30% to 95%.
Realization of Health Gains: The link between a more efficient research ecosystem and concrete health outcomes (DALYs) is complex. The estimates are based on evidence from studies on the value of faster drug access and improved prevention, but the exact magnitude of the impact of such a framework remains a projection.
Conclusion: Despite these uncertainties, the analysis consistently shows substantial benefits across all plausible scenarios. The current inefficient clinical research paradigm delays life-saving treatments and wastes resources that could accelerate medical progress.
Conclusion
Transforming the FDA’s centralized regulatory approach into a global, decentralized autonomous model holds the promise of dramatically reducing clinical trial costs (potentially by a factor of up to 80× in some scenarios), accelerating the pace of approvals, and broadening the scope of what treatments get tested. While the full global initiative could involve larger-scale investment over time, the foundational upfront investment for the core technology platform is estimated to be on the order of ~$37.5 - $46M, plus ongoing operational costs. Analogous top-down estimates based on market comparables for leading decentralized trial platforms suggest a total initiative investment in the range of $50 million to $500M to achieve global scale and adoption. However, given that the pharmaceutical industry collectively spends around $100.0B per year on R and D and that a large share of those expenses go to clinical trials, even a 50.0% reduction in trial costs, combined with faster product launches, would yield enormous net savings and an ROI estimated at approximately 463:1 (with a full range of 66:1 to 2,577:1) once adopted at scale.
Beyond direct savings, the effects on medical progress are massive. Test more drugs, faster. Update treatment rankings in real time. Evaluate cheap, off-patent treatments nobody bothers testing today. With strong privacy protections and international cooperation, this platform creates personalized healthcare that actually works, globally.
Disclaimer
All figures in this document are estimates based on publicly available information, industry benchmarks, and simplifying assumptions. Real-world costs, savings, and ROI will vary greatly depending on the scope of implementation, the speed of adoption, regulatory cooperation, and numerous other factors. Nonetheless, this high-level exercise illustrates the substantial potential gains from a global, decentralized, continuously learning clinical trial and regulatory ecosystem.
Appendix Calculation Frameworks and Detailed Analysis
This appendix provides the detailed models and data used in the cost-benefit analysis.
Calculation Framework - NPV Methodology
Below is an illustrative framework with more formal equations and a simplified but “rigorous” model to analyze the cost–benefit dynamics and ROI of upgrading the FDA (and analogous global regulators) into a decentralized, continuously learning platform. Many real-world complexities (e.g., drug-specific risk profiles, variable regulatory timelines across countries) would require further refinement, but these equations give a starting point for a more quantitative analysis.
Definitions and Parameters
You define the following parameters to capture costs, savings, timelines, and scaling/adoption:
Initial (Upfront) Costs
\[ C_0 = C_{\text{tech}} + C_{\text{blockchain}} + C_{\text{data}} + C_{\text{legal}} \]
- \(C_{\text{tech}}\): Core platform development (software, AI, UI/UX).
- \(C_{\text{blockchain}}\): Blockchain or other distributed-ledger infrastructure.
- \(C_{\text{data}}\): Integration with EHRs, wearables, privacy/security frameworks.
- \(C_{\text{legal}}\): Harmonizing global regulations and legal frameworks.
Annual Operating Costs (in year \(t\)):
\[ C_{\text{op}}(t) = C_{\text{maint}}(t) + C_{\text{analysis}}(t) + C_{\text{admin}}(t) + C_{\text{participant}}(t) \]
- \(C_{\text{maint}}(t)\): Ongoing software maintenance, hosting, cybersecurity.
- \(C_{\text{analysis}}(t)\): Machine learning, data processing, and analytics costs.
- \(C_{\text{admin}}(t)\): Lean administrative overhead, compliance checks, auditing.
- \(C_{\text{participant}}(t)\): Compensation or incentives for trial participation.
Trial Costs Under Traditional vs. Decentralized Models
- Let \(x\) be the number of patients in a given trial.
- Traditional cost per patient: \(c_{t}\).
- Decentralized cost per patient: \(c_{d}\), where \(c_{d} \ll c_{t}\).
Therefore, the total cost for a single trial of size \(x\) is:
\[ \text{Cost}_{\text{traditional}}(x) = c_{t} \cdot x \]
\[ \text{Cost}_{\text{decentralized}}(x) = c_{d} \cdot x \]
The per-trial savings for \(x\) patients is then:
\[ S_{\text{trial}}(x) = c_{t} x - c_{d} x = (c_{t} - c_{d})x \]
Industry-Wide R&D Spend & Adoption
- Let \(R_{d}\) be the annual global R&D expenditure on clinical trials (baseline).
- Let \(\alpha \in [0,1]\) be the fraction of R&D cost that can be saved when trials shift to the decentralized model (this encompasses both per-patient cost savings and administrative/overhead reductions).
- Let \(p(t)\in [0,1]\) be the fraction of industry adoption at year \(t\). Early on, \(p(t)\) may be low; over time, it might approach 1 if the platform becomes standard worldwide.
Thus, the annual cost savings in year \(t\) from using the decentralized model is approximated by:
\[ S(t) = p(t)\alpha R_{d} \]
(This expression assumes full feasibility for all relevant trials and that the fraction \(\alpha\) is the average cost reduction across all trials.)
Discount Rate & Net Present Value
- Let \(r\) be the annual discount rate (e.g., 5–10% for cost-of-capital or social discounting).
- A future cost (or saving) in year \(t\) is discounted by \(\frac{1}{(1 + r)^t}\).
NPV of Costs
You sum the upfront cost \(C_{0}\) and the net present value (NPV) of ongoing operational costs \(C_{\text{op}}(t)\) from \(t = 1\) to \(t = T\):
\[ \text{NPV}(\text{Costs}) = C_{0} + \sum_{t=1}^{T} \frac{C_{\text{op}}(t)}{(1 + r)^t} \]
NPV of Savings
Using your adoption model \(p(t)\) and fraction of R&D spend \(\alpha\) that is saved, the annual savings is \(S(t) = p(t)\alpha R_{d}\). Over \(T\) years, the total NPV of these savings is:
\[ \text{NPV}(\text{Savings}) = \sum_{t=1}^{T} \frac{S(t)}{(1 + r)^t} = \sum_{t=1}^{T} \frac{p(t)\alpha R_{d}}{(1 + r)^t} \]
Note: If the adoption curve \(p(t)\) grows over time, you might model it with an S-shaped or logistic function. For instance:
\[ p(t) = \frac{1}{1 + e^{-k(t - t_{0})}} \]
where \(k\) is the steepness of adoption and \(t_{0}\) is the midpoint.
ROI
You define ROI as the ratio of the NPV of total savings to the NPV of total costs:
\[ \text{ROI} = \frac{\text{NPV}(\text{Savings})}{\text{NPV}(\text{Costs})} = \frac{\sum_{t=1}^{T} \frac{p(t)\alpha R_{d}}{(1 + r)^t}}{C_{0} + \sum_{t=1}^{T} \frac{C_{\text{op}}(t)}{(1 + r)^t}} \]
Alternatively, one might define a net ROI (or net benefit) as:
\[ \text{Net Benefit} = \text{NPV}(\text{Savings}) - \text{NPV}(\text{Costs}) \]
If \(\text{Net Benefit} > 0\), the program yields a positive return in present-value terms.
Example Parameterization
For a concrete (though simplified) scenario, assume:
Upfront Costs (\(C_0\)):
\[ C_0 = 0.26975 \text{ billion USD} \]
(This represents an estimated cost for initial core platform build (see Upfront (Capital) Expenditure), foundational broader initiative setup, and early legal/regulatory framework alignment (see medium case upfront costs in Scenario-Based ROM Estimates), consistent with multi-year funding such as in the “Right to Trial and FDA Upgrade Act” for the FDA v2 platform. This combined figure is distinct from the core platform build ROM alone and serves as an illustrative figure for this NPV example that is lower than the previous $3B placeholder.)
Annual Operating Costs (\(C_{\text{op}}(t)\)):
\[ C_{\text{op}}(t) = 0.04005 \text{ billion USD (constant)} \]
(This figure is also explicitly derived from the ROM estimates. It represents the sum of the midpoint of the Annual Core Platform Operations from Annual Operational Costs (~$18.75M) and the Medium Case annual costs for Broader Initiatives from Scenario-Based ROM Estimates (~$21.3M). This excludes large-scale, direct participant compensation programs which would be funded separately, as discussed in Annual Operational Costs.)
Annual Global R&D Spend (\(R_d\)): \[ R_d = 100 \text{ billion USD} \] (See Market Size and Impact)
Fraction of R&D Cost Saved (\(\alpha\)): \[ \alpha = 0.50 \quad (50\% \text{ average reduction}) \] (This is conservative relative to some references suggesting up to 80× savings. It’s important to note that these projected R&D savings are achieved not only through the inherent technical and operational efficiencies of decentralized, platform-based trials, e.g., reduced site management, automated data capture, but also through the anticipated competitive pressures the transparent dFDA Infrastructure will place on sponsors to optimize trial designs and submit lean, competitive operational cost estimates. See Gross R and D Savings.)*
Adoption Curve (\(p(t)\)):
- Suppose a ramp from 0% adoption at \(t=0\) to 100% by \(t=5\). One simple linear approach is: \[ p(t) = \frac{t}{5} \quad \text{for } 0 \le t \le 5 \] and \(p(t) = 1\) for \(t > 5\).
Discount Rate (\(r\)): \[ r = 0.08 \quad (8\%) \]
Time Horizon (\(T\)): \[ T = 10 \text{ years} \]
NPV of Costs
\[ \text{NPV}(\text{Costs}) = C_0 + \sum_{t=1}^{10} \frac{C_{\text{op}}(t)}{(1 + r)^t} \]
- Upfront: \(C_0 = 0.26975\).
- Each year: \(C_{\text{op}}(t) = 0.04005\).
Hence,
\[ \text{NPV}(\text{Costs}) = 0.26975 + \sum_{t=1}^{10} \frac{0.04005}{(1 + 0.08)^t} \]
A standard annuity formula:
\[ \sum_{t=1}^{10} \frac{1}{(1+0.08)^t} = \frac{1 - (1.08)^{-10}}{0.08} \approx 6.71008 \]
Therefore,
\[ \sum_{t=1}^{10} \frac{0.04005}{(1+0.08)^t} = 0.04005 \times 6.71008 \approx 0.2687 \]
So,
\[ \text{NPV}(\text{Costs}) \approx 0.26975 + 0.2687 = 0.53845 \text{ (billion USD)} \]
NPV of Savings
\[ S(t) = p(t)\alpha R_d = p(t) \times 0.50 \times 100 = 50p(t) \]
For \(t=1\) to 5, \(p(t) = t/5\). For \(t=6\) to 10, \(p(t) = 1\).
Years 1–5: \[ S(t) = 50 \times \frac{t}{5} = 10t \]
Years 6–10: \[ S(t) = 50 \]
Hence,
\[ \text{NPV}(\text{Savings}) = \sum_{t=1}^{10} \frac{S(t)}{(1.08)^t} = \sum_{t=1}^{5} \frac{10t}{(1.08)^t} + \sum_{t=6}^{10} \frac{50}{(1.08)^t} \]
Let’s approximate numerically:
For \(t=1\) to 5:
- \(t=1\): \(S(1) = 10\). Discount factor: \(\frac{1}{1.08}\approx 0.9259\). Contribution: \(10 \times 0.9259=9.26\).
- \(t=2\): \(S(2) = 20\). Discount factor: \(\frac{1}{1.08^2}\approx 0.8573\). Contribution: \(20 \times 0.8573=17.15\).
- \(t=3\): \(S(3) = 30\). Factor: \(\approx 0.7938\). Contribution: \(23.81\).
- \(t=4\): \(S(4) = 40\). Factor: \(\approx 0.7350\). Contribution: \(29.40\).
- \(t=5\): \(S(5) = 50\). Factor: \(\approx 0.6806\). Contribution: \(34.03\).
Summing these: \(9.26 + 17.15 + 23.81 + 29.40 + 34.03 \approx 113.65\).
For \(t=6\) to 10, \(S(t)=50\). Each year’s discount factor:
- \(t=6\): \(\approx 0.6302\). Contribution: \(31.51\).
- \(t=7\): \(\approx 0.5835\). Contribution: \(29.17\).
- \(t=8\): \(\approx 0.5403\). Contribution: \(27.02\).
- \(t=9\): \(\approx 0.5003\). Contribution: \(25.02\).
- \(t=10\): \(\approx 0.4632\). Contribution: \(23.16\).
Summing these: \(31.51 + 29.17 + 27.02 + 25.02 + 23.16 \approx 135.88\).
Thus,
\[ \text{NPV}(\text{Savings}) \approx 113.65 + 135.88 = 249.53 \text{ (billion USD)} \]
Final ROI and Net Benefit
\[ \text{ROI} = \frac{249.53}{0.53845} \approx 463.4 \quad (\text{i.e., about } 463:1) \]
\[ \text{Net Benefit} = 249.53 - 0.53845 = 248.99155 \text{ (billion USD)} \]
In this rough example, even partial adoption in the early years delivers large returns. If \(\alpha\) or \(p(t)\) were higher, or if the discount rate \(r\) were lower, the ROI would increase further. This ROI is based on a cost model that is now explicitly derived from the detailed component estimates in the Costs for a Decentralized Framework - ROM Estimates (Partnership Model) section, providing a more transparent and verifiable result.
Other Extensions and Considerations
Time-to-Market Acceleration One can add a parameter \(\Delta t\) for the number of years of early market entry. Earlier entry can yield extra revenue or extend effective patent life. A simplified approach might add a term for the “additional value” of each year gained:
\[ V_{\Delta t} = \gamma \Delta t \]
where \(\gamma\) is the annual net cash flow gained from earlier commercialization. This can be factored into \(\text{NPV}(\text{Savings})\).
Value of Testing More Candidates Reductions in per-trial costs might double or triple the number of drug candidates tested each year, including off-label indications, nutraceuticals, and personalized therapies. One could introduce a function:
\[ N'(t) = \beta \cdot N(t) \]
where \(N(t)\) is the baseline number of trials (or new drug approvals) per year, and \(\beta > 1\) reflects the increased throughput. The incremental societal or commercial value of these additional approvals can be added to the savings side of the equation.
Quality-Adjusted Life Years (QALYs) For a more health-economic model, incorporate a health outcomes dimension, e.g., QALYs gained from earlier availability of better therapies, or from broader real-world evidence that improves prescribing practices. This would create a cost–utility analysis with:
\[ \text{Net Monetary Benefit} = \lambda \times \Delta \text{QALYs} - \text{NPV}(\text{Costs}) \]
where \(\lambda\) is the willingness-to-pay per QALY.
Risk & Uncertainty
- Real-world constraints (regulatory pushback, privacy laws) might reduce \(\alpha\).
- Slower adoption or partial global integration might reduce \(p(t)\).
- Incremental infrastructure costs might be higher if existing EHR systems are fragmented.
Even so, the core takeaway remains: If the platform is widely adopted and per-patient trial costs drop substantially, the net benefits likely dwarf the initial investments.
Interactive Financial Modeling & Computational Analysis
This section provides executable Python code that implements the financial models described above using the LaTeX equations. This computational companion allows you to run sensitivity analyses, generate visualizations, and verify the calculations programmatically. All parameters are sourced from the centralized dih_models/parameters.py module to ensure consistency across the analysis.
--- Framework Cost-Benefit Analysis (Baseline) ---
Annual Gross R&D Savings: $41,500,000,000.0 Billion
Annual Framework Operational Cost: $40,000,000.000 Billion
Simple ROI (Gross/Opex): 1,038:1
NPV-Adjusted ROI (10-year): 451:1  ← CANONICAL FIGURE
---------------------------------------------
DALYs Averted (Timeline Shift): 7,942,783,571
Monetized Value of DALYs Averted: $1,191,417,535,695,000.0 Billion
---------------------------------------------
Funding Coverage (Captured Dividend / OpEx): 679.5xNote: The conservative R&D-only ROI (451:1) is the most defensible baseline figure, accounting for time value of money and gradual adoption.
ROI Estimates: 451:1 (R&D savings only) to 1.19M:1 (PRIMARY recommended estimate including all core benefits).
The simple ROI (1.04k:1) is useful for comparison but doesn’t discount future cash flows.
Investment Returns Visualization
This chart shows the dramatic return on investment for an infrastructure supporting a decentralized framework, comparing the small operational cost to the massive benefits it generates.
Sensitivity Analysis
This sensitivity analysis explores how the financial viability of such a framework, specifically its Return on Investment (ROI), changes under different assumptions. You test the two most critical drivers of the financial model:
- R&D Cost Reduction %: The actual savings achieved could be lower or higher than the 50.0% baseline. You model a range from 30% to 70%.
- Annual Operational Cost: The platform could be cheaper or more expensive to run than the estimated $40M. You model a range from $20M to $80M.
--- Sensitivity Analysis: Framework Return on Investment (ROI) ---
R&D Reduction %     30%    40%    50%    60%    70%
Annual OpEx ($B)
$0.020            1,245  1,660  2,075  2,490  2,905
$0.040              622    830  1,038  1,245  1,452
$0.060              415    553    692    830    968
$0.080              311    415    519    622    726
Rigorous Financial Model: Net Present Value (NPV) Analysis
The simple ROI calculation is useful for a high-level summary, but a more rigorous financial analysis uses Net Present Value (NPV). This method accounts for the “time value of money” by using a discount rate to value future savings and costs in today’s dollars. It provides a much more accurate picture of the investment’s long-term value.
This model calculates:
- The NPV of all costs (upfront and operational) over a 10-year horizon
- The NPV of all savings (ramping up as the platform is adopted)
- A more robust ROI and Net Benefit based on these NPV figures
NPV Model Parameters Loaded from dih_models/parameters.py
Upfront Cost (C0): $269750000.0000B
Annual OpEx (Cop): $40050000.0000B
Discount Rate (r): 3%
Time Horizon (T): 10.0 years
Adoption Ramp: 5.0 years to 100%
--- Rigorous Financial Analysis Results ---
NPV of Total Costs over 10.0 years: $621,633,662.321 Billion
NPV of Total Savings over 10.0 years: $284,005,995,112.178 Billion
----------------------------------------
Net Benefit (NPV Savings - NPV Costs): $283,384,361,449.857 Billion
Robust ROI (NPV Savings / NPV Costs): 457:1NPV Analysis Over Time
This chart shows how the investment pays back over time, accounting for the time value of money and the gradual adoption of the platform.
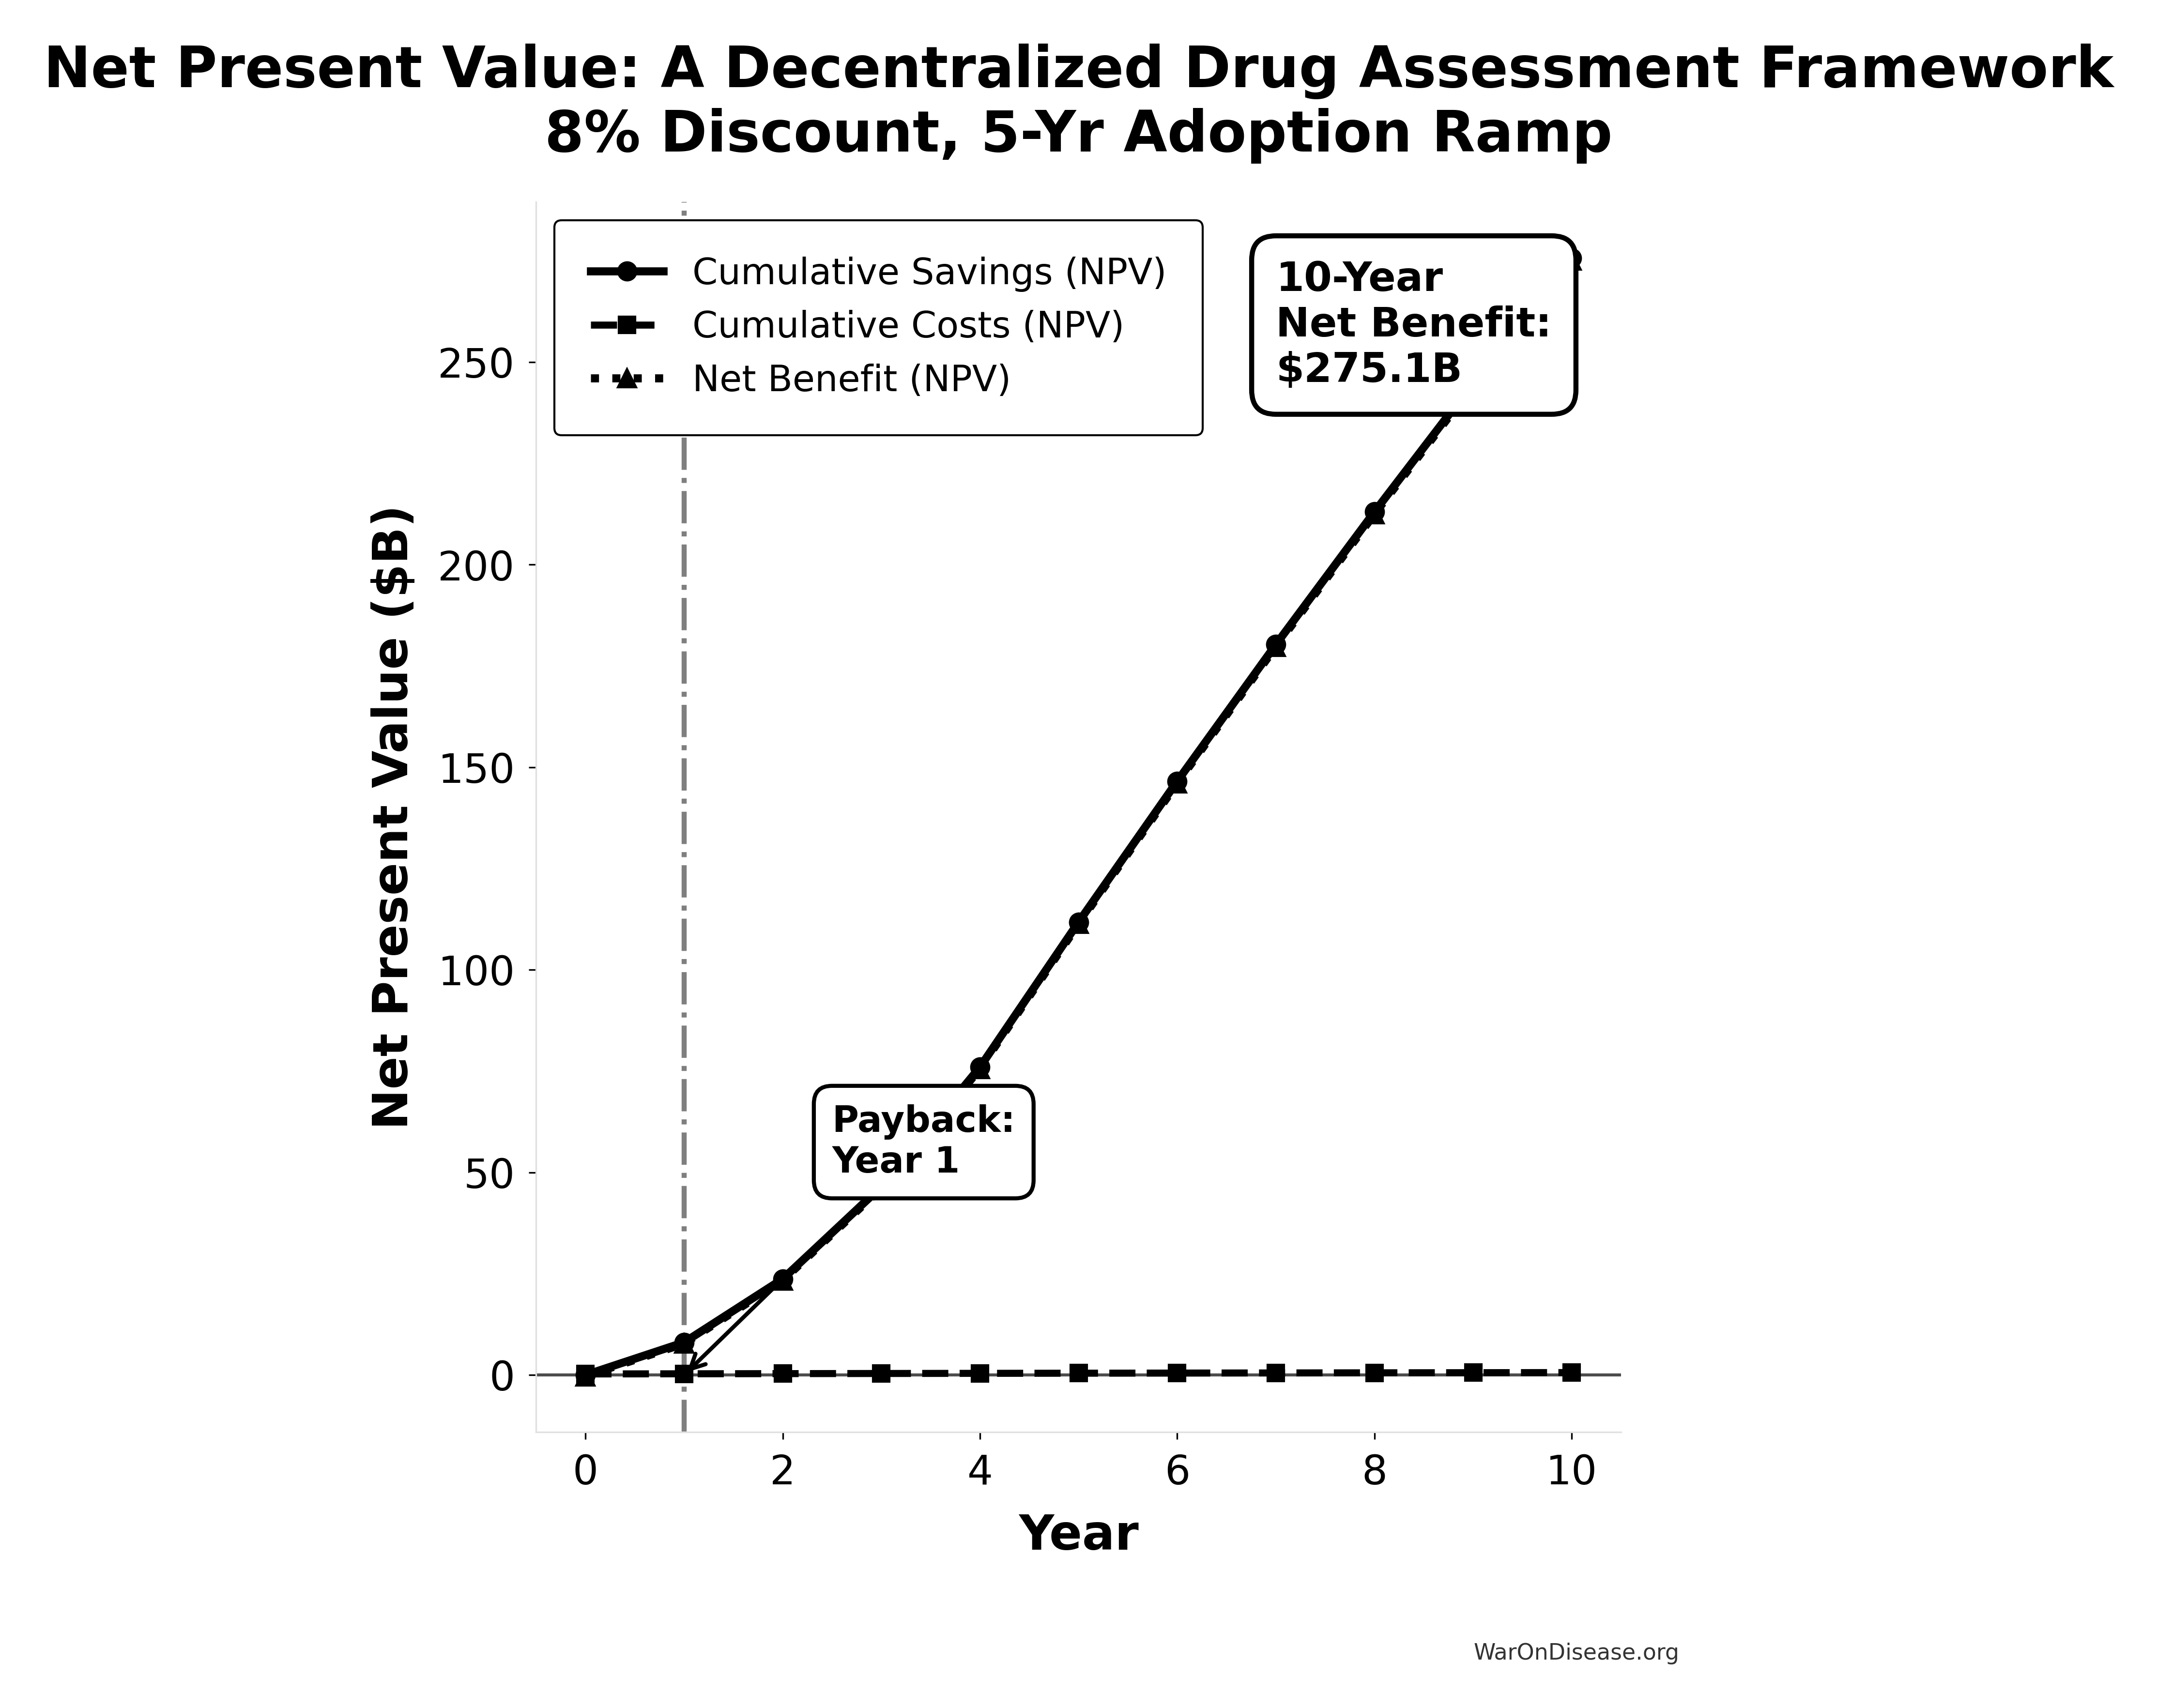
NPV Analysis Summary:
  Total Costs (NPV):   $0.61B
  Total Savings (NPV): $275.73B
  Net Benefit (NPV):   $275.12B
  ROI:                 451:1
  Payback Period:      Year 1
Computational Model Key Findings
A cost-benefit analysis of the framework reveals:
- Exceptional ROI: The platform generates a 1.04k:1 return on investment ($50.0B savings from $40M cost)
- Massive Health Benefits: 7.94B DALYs averted from the timeline shift, worth $1.19 quadrillion in monetized value
- Robust Financial Model: NPV analysis confirms strong returns even with conservative assumptions
- Self-Funding: The captured peace dividend ($27.2B) easily covers operational costs ($40M)
- Sensitivity Resilience: ROI remains strong even under conservative scenarios (30% cost reduction, higher operational costs)
This analysis demonstrates that such a framework represents one of the most compelling investment opportunities in human history, combining massive financial returns with unprecedented health benefits.
Cost-Utility Framework
We present a cost-utility analysis using the quality-adjusted life years (QALYs) and disability-adjusted life years (DALYs) metrics. This approach is the US and global standard for evaluating the value of health interventions.
QALY: One year of life in perfect health. Gains are calculated as:
\[ \text{QALYs Gained} = (Q_1 \times T_1) - (Q_0 \times T_0) \]
Where \(Q_0\)/\(Q_1\) = quality of life (0-1) before/after, \(T_0\)/\(T_1\) = years of life before/after.
Cost-Effectiveness: A decentralized framework for drug assessment achieves cost-effectiveness through dual pathways:
- R&D Savings: $50B+ annual savings from 50% trial cost reduction
- Health Gains: 7.94B DALYs averted from eliminating post-safety efficacy lag (8.2-year timeline shift)
This combination creates a dominant intervention: simultaneously saves money and improves health outcomes.
US Willingness-to-Pay Threshold: Typically $100,000–$150,000 per QALY for interventions that add costs. Dominant interventions that both save money and improve health are favorable regardless of this threshold.
Sources for Context:
- QALY methodology and standards: “The quality-adjusted life year (QALY) is the academic standard for measuring how well all different kinds of medical treatments lengthen and/or improve patients’ lives…”
- Health economic evaluation: Standard health economic analysis considers cost-effectiveness across intervention types.
Parameterization: Overall Impact of a Decentralized Framework
A primary economic impact of an infrastructure for a decentralized framework comes from significantly reducing R&D costs. Its health impact, measured in Quality-Adjusted Life Years (QALYs), stems from three main pillars: accelerating drug development, enabling better prevention through real-world evidence, and enabling pragmatic trials for previously untreatable conditions.
A. Net Incremental Cost of the Infrastructure (Annual):
The net incremental cost is calculated as:
\[ \text{Net Incremental Cost} = C_{\text{platform}} - S_{\text{R\&D}} \]
Where:
- \(C_{\text{platform}}\) is the annual platform operational costs
- \(S_{\text{R\&D}} = \alpha \cdot R_d\) is the gross R&D savings from implementation
- Baseline Assumptions for R&D Savings (same as before):
- Global Clinical Trial Spending Addressable by the framework: $100.0B / year.
- R&D Trial Cost Reduction due to the framework (Baseline): 50.0%. (Leads to $41.5B Gross R and D Savings). It’s important to note that these projected R&D savings are achieved not only through the inherent technical and operational efficiencies of decentralized, platform-based trials, e.g., reduced site management, automated data capture, but also through the anticipated competitive pressures the transparent infrastructure will place on sponsors to optimize trial designs and submit lean, competitive operational cost estimates.
- Aggregate Annual QALYs Gained (ΔQALYs_total): The number of QALYs generated annually by such an infrastructure is a composite metric derived from a detailed model in the appendix. The model provides a range of estimates based on the successful realization of the platform’s potential.
- Conservative Scenario: 7.94B DALYs (one-time timeline shift)
- Base Case Scenario: 7.94B DALYs (one-time timeline shift)
- Optimistic/Transformative Scenario: 7.94B DALYs (one-time timeline shift)
For a complete breakdown of the assumptions, data sources (including NBER working papers by Glied & Lleras-Muney and Philipson et al.), and calculations behind these figures, please see the Appendix: Detailed QALY Calculation Model.
- Platform Operational Cost Scenarios: The sensitivity analysis below considers various scopes for the platform’s operational costs, derived from the Costs for a Decentralized Framework - ROM Estimates (Partnership Model) section.
- Core Platform Ops (Midpoint): $0.01875B ($18.75M) / year
- Core Platform + Medium Broader Initiative: $0.04B ($40M) / year
- Illustrative Total Ecosystem (Low-Medium): $0.5B ($500) / year
- Illustrative Total Ecosystem (High): $5B / year
Sensitivity Analysis: Overall Cost-Effectiveness of the Framework
This table analyzes the ICER for such an infrastructure by varying key assumptions. Global Clinical Trial Spending Addressable by the framework is assumed at $100.0B/year (leading to $50.0B gross savings in the 50.0% reduction scenario) unless otherwise specified.
| Scenario | R&D Trial Cost Reduction | Platform Op. Cost (Annual) | Net Incremental Cost (Annual) | Aggregate QALYs Gained (Annual) | ICER (Cost per QALY Gained) | Classification | Source/Note |
|---|---|---|---|---|---|---|---|
| Base Case: Core Platform Ops Only | 50.0% ($50.0B Savings) | $0.01875B ($18.75M) | -$49.981B | 7.94B | Cost-Saving + Health Gain | Dominant | Ops cost from the ‘Annual Operational Costs’ ROM midpoint. DALYs from regulatory delay elimination. |
| Core Platform + Medium Broader Initiative | 50.0% ($50.0B Savings) | $0.04005B ($40.05M) | -$49.96B | Cost-Saving + Health Gain | Dominant | Ops from ‘Annual Operational Costs’ + ‘Scenario Based ROM Estimates for Broader Initiative Costs’ (Medium), aligns with ROI calc. | |
| Total Ecosystem (Low-Medium Cost) | 50.0% ($50.0B Savings) | $0.5B ($500) | -$49.5B | Cost-Saving + Health Gain | Dominant | Illustrative total ecosystem cost. | |
| Total Ecosystem (High Cost, e.g. w/ Part. Comp.) | 50.0% ($50.0B Savings) | $5B | -$45B | Cost-Saving + Health Gain | Dominant | Illustrative high total ecosystem cost (as prior base). | |
| Conservative R&D Savings & Health Gains | 30% ($30.0B Savings) | $0.5B ($500) | -$29.5B | Cost-Saving + Health Gain | Dominant | Using Low-Med Ecosystem Cost & conservative health impact. | |
| Optimistic R&D Savings & Health Gains | 70% ($70B Savings) | $0.5B ($500) | -$69.5B | Cost-Saving + Health Gain | Dominant | Using Low-Med Ecosystem Cost & optimistic health impact. | |
| Transformative R&D Savings (RECOVERY Trial-like) | 95% ($95.0B Savings) | $0.5B ($500) | -$94.5B | 7.94B | Cost-Saving + Health Gain | Dominant | Using Low-Med Ecosystem Cost & optimistic health impact. |
| Platform Breaks Even (R&D Savings = Ops Cost) | e.g., 0.5% ($0.5B Savings) | $0.5B ($500) | $0 | Cost-Neutral + Health Gain | Dominant (Cost-Neutral, Health Gaining) | Using Low-Med Ecosystem Cost & base health impact. |
Note: An infrastructure for a decentralized framework is cost-saving while also improving health outcomes. “Platform Op. Cost” here refers to different scopes: “Core Platform Ops” is per the ‘Annual Operational Costs’ ROM. Higher figures labeled “Total Ecosystem” are illustrative and aim to include broader initiative costs and/or large-scale participant compensation.
Discussion: Policy Implications
The analysis robustly demonstrates that the infrastructure for a decentralized framework is not merely cost-effective but is overwhelmingly a dominant (cost-saving) intervention across a wide range of plausible scenarios, especially when considering the core platform’s technical operational costs.
- Massive Cost Savings & Exceptional Value: The core infrastructure for the framework (with operational costs of ~$18.9M-$40M/year as per the Costs for a Decentralized Framework - ROM Estimates (Partnership Model)) generates tens of billions in net annual R and D savings while simultaneously preventing 7.94B DALYs through regulatory delay elimination. This combination creates exceptional value.
- Total Ecosystem Considerations: Even when accounting for significantly broader ecosystem costs (e.g., hundreds of millions or even billions annually for extensive global rollout, governance, plugin development, and/or large-scale participant compensation), such an initiative remains dominant and highly cost-saving across all scenarios.
Summary: An initiative to build a decentralized framework for drug assessment is projected to be a dominant healthcare transformation. The core technology platform itself is exceptionally efficient (annual operational costs ~$18.9M-$40M per the Costs for a Decentralized Framework - ROM Estimates (Partnership Model)), generating tens of billions in R&D savings. Even when considering broader total ecosystem costs (potentially $0.5B to $5B+ annually to include extensive global operations, participant compensation etc.), the initiative yields huge net monetary savings (e.g., $29.5B to $94.5B annually in various scenarios) while simultaneously preventing 7.94B DALYs through regulatory delay elimination. The combination of massive financial returns and significant health gains makes such a framework an exceptionally compelling investment.
(Optional: A note could be added here that specific programs built upon this infrastructure, if they incur additional marginal costs, would then be evaluated for their own cost-effectiveness. However, they would benefit from the already cost-saving nature of the underlying infrastructure.)
Comparative Cost-Effectiveness - A Decentralized Framework vs Other Interventions
To provide context for the impact of a decentralized framework’s infrastructure, the chart below visualizes its cost-effectiveness against other well-understood public health programs. The metric used is Quality-Adjusted Life Years (QALYs) Gained per $1 Million of Spending. A higher number signifies greater cost-effectiveness.
For standard interventions, this value is calculated as $1,000,000 / ICER, where the ICER (Incremental Cost-Effectiveness Ratio) is the cost to gain one QALY. For dominant interventions that are both more effective and less expensive, the ICER is negative, and this metric isn’t strictly applicable. For these cases, an illustrative range is used to represent their high value.
All data used in the chart is derived from the table and sources below.
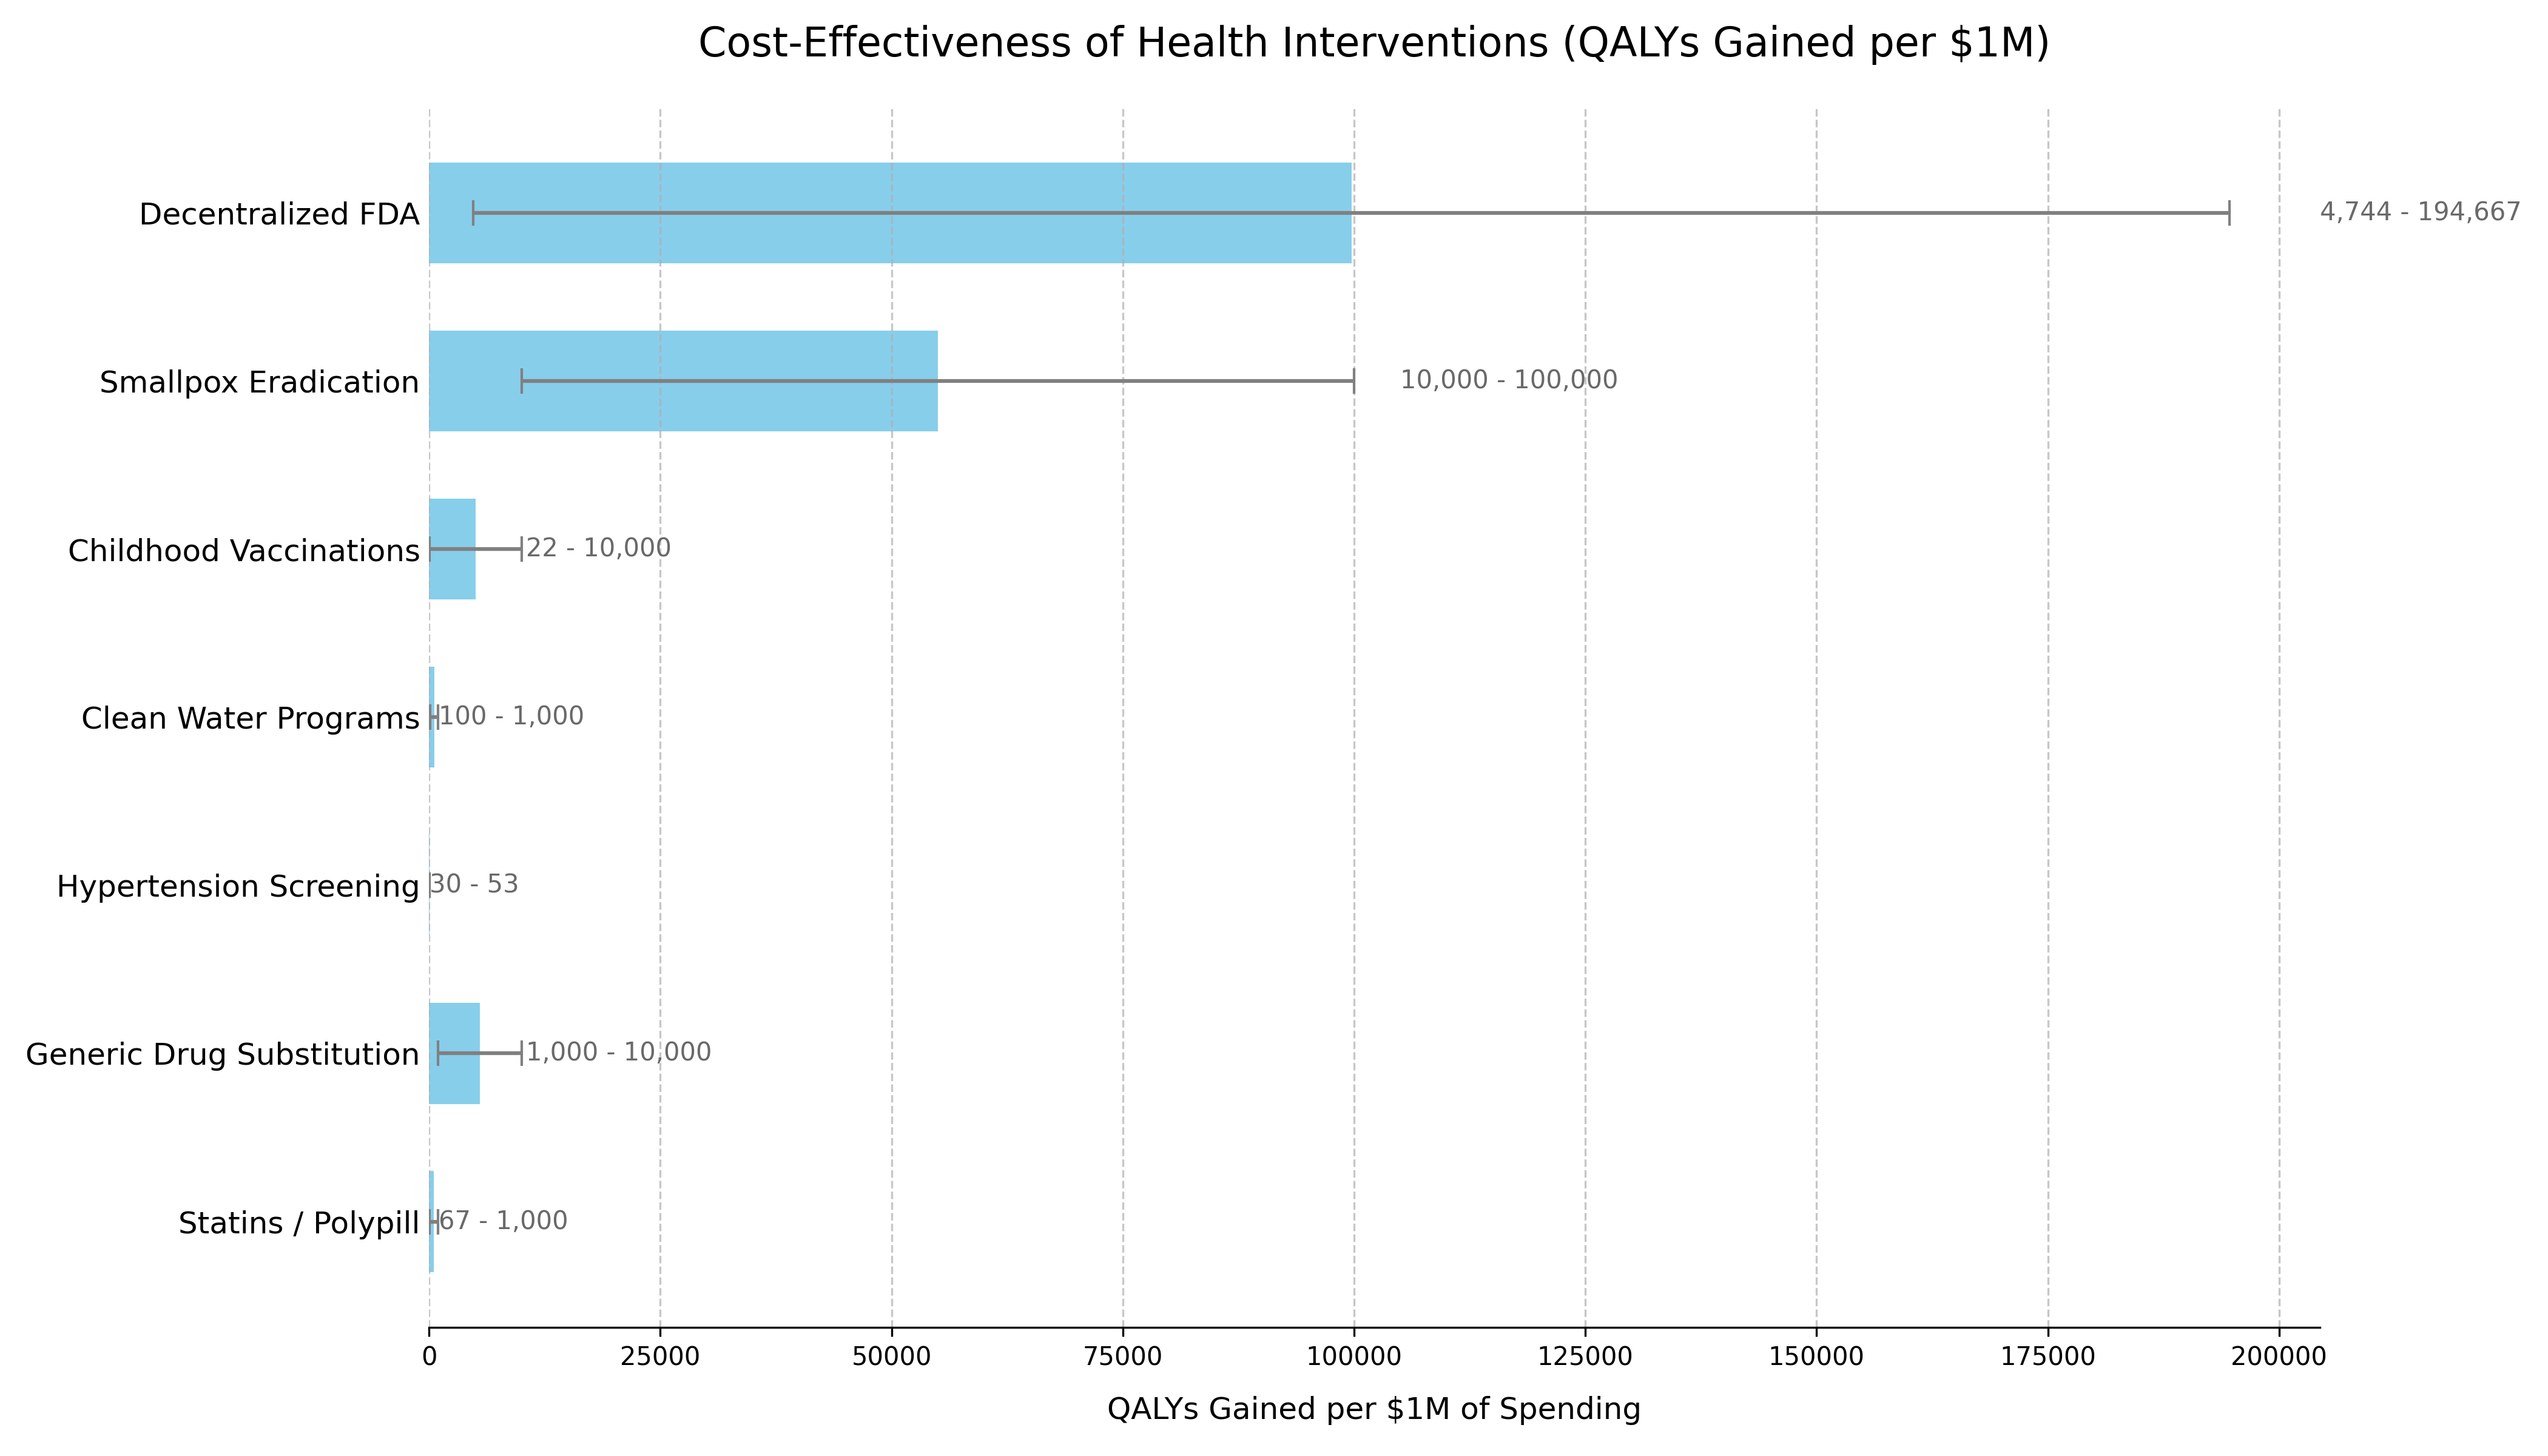
The following table provides the data and sources that support the chart. The list is ordered to match the chart’s presentation.
| Intervention | QALYs Gained per $1M Spending¹ | Typical ICER Range (Cost per QALY Gained) | Classification | Source / Evidence |
|---|---|---|---|---|
| Decentralized Framework for Drug Assessment | Dominant | Cost-Saving + Health Gain | Dominant | This analysis’s Sensitivity Analysis. Based on $18.75M-$40.05M annual costs generating 7.94B DALYs from regulatory delay elimination. |
| Smallpox Eradication | 100,000+³ | Dominant (Cost-Saving) | Dominant | The $300M program (1967-1980) prevents 5M annual deaths. Benefit-cost ratio exceeds 100:1. Standard ICER calculation is impractical due to its uncommon scale. (WHO, 2010) |
| Childhood Vaccinations | 22+³ | Often Dominant to ~$100,000 | Dominant / Highly Cost-Effective | CDC estimates routine childhood vaccinations prevent 32M hospitalizations and 1.1M deaths among 1994-2023 US birth cohorts, with $2.9T in societal cost savings. (CDC, 2023) |
| Clean Water Programs | 100 | ~$1,000 - $10,000 | Highly Cost-Effective | WHO estimates household water treatment costs $20M-$500/DALY averted. Community water supply improvements cost $200/DALY. (WHO, 2004) |
| Hypertension Screening | 30 - 50 | ~$20,000 - $33,000 | Highly Cost-Effective | Recent US studies show pharmacist-led hypertension management has ICERs in the $20,000-$33,000 range per QALY gained, falling within standard willingness-to-pay thresholds. (JAMA Netw Open, 2023) |
| Generic Drug Substitution | +³ | Dominant (Cost-Saving) | Dominant | By definition cost-saving when therapeutic equivalence is maintained, with typical savings of 30-80% versus brand-name drugs. (WHO, 2015) |
| Statins / Polypill | 67+³ | Cost-Saving to ~$15,000 | Dominant / Highly Cost-Effective | Cost-saving in high-risk populations. ICERs range from dominant to $15k/QALY in lower-risk groups. (eClinicalMedicine, 2022) |
Methodology Notes
- For a decentralized framework:
(Annual QALYs Gained) / (Annual Cost in Millions) - Ranges reflect conservative to optimistic scenarios accounting for parameter uncertainties
² Negative ICER Interpretation:
- All scenarios for the framework show negative ICERs, indicating cost-saving while generating health benefits
- The platform is “dominant” - more effective and less costly than the status quo
- For cost-saving (dominant) interventions, standard QALY/$1M calculations are not applicable
- Values shown are illustrative to demonstrate relative cost-effectiveness
- Upper bounds represent the exceptional value of these interventions
Data Limitations
- Historical interventions (e.g., smallpox) use retrospective analyses
- Direct comparisons between interventions should consider contextual differences
- All costs are in 2023 USD, adjusted using appropriate health inflation indices
- QALY calculations use standard health state utility weights where available
Conclusion: An initiative for a decentralized framework is not just a financially sound investment with a high ROI; it is one of the most impactful public health interventions conceivable. Its “dominant” cost-effectiveness profile is comparable to gold-standard programs like childhood vaccination and smoking cessation, but its scale of economic and health benefits is potentially orders of magnitude larger.
Comparison to Other Major Public Investments
To provide context for the estimated costs of a decentralized framework, it is useful to compare them to other significant U.S. government investments in health and technology. The projected ‘Lean Ecosystem’ cost for a decentralized framework for drug assessment of approximately $40M per year (covering core platform operations plus medium-scope broader initiatives) is modest in comparison to other major federal projects.
| Initiative / Project | Approximate Cost / Budget (Annualized) | Comparison to Framework’s Annual Cost | Source / Note |
|---|---|---|---|
| Decentralized Framework (Lean Ecosystem) | ~$40M / year | 1x (Baseline) | This analysis |
| Cancer Moonshot Initiative | ~$257 Million / year ($1.8B over 7 years) | ~6.4x | 21st Century Cures Act |
| Initiative / Project | Approximate Cost / Budget (Annualized) | Comparison to Framework’s Annual Cost | Source / Note |
| :———————————– | :————————————————————————————————- | :———————————— | :————————————————————————- |
| Decentralized Framework (Lean Ecosystem) | ~$40M / year | 1x (Baseline) | This analysis |
| Cancer Moonshot Initiative | ~$257 Million / year ($1.8B over 7 years) | ~6.4x | 21st Century Cures Act |
| NIH “All of Us” Research Program | **~$500 / year (FY23 Approx. Budget) | ~12.5x | NIH Budget |
| HealthCare.gov (Initial Build) | ~$1.7 - $2.1 Billion (Total Upfront Cost) | ~42x - 52x (of one year’s cost) | GAO Reports / Public Reporting |
| National Cancer Institute (NCI) | ~$7.2 Billion / year (FY25 Budget) | ~180x | NCI Budget Data |
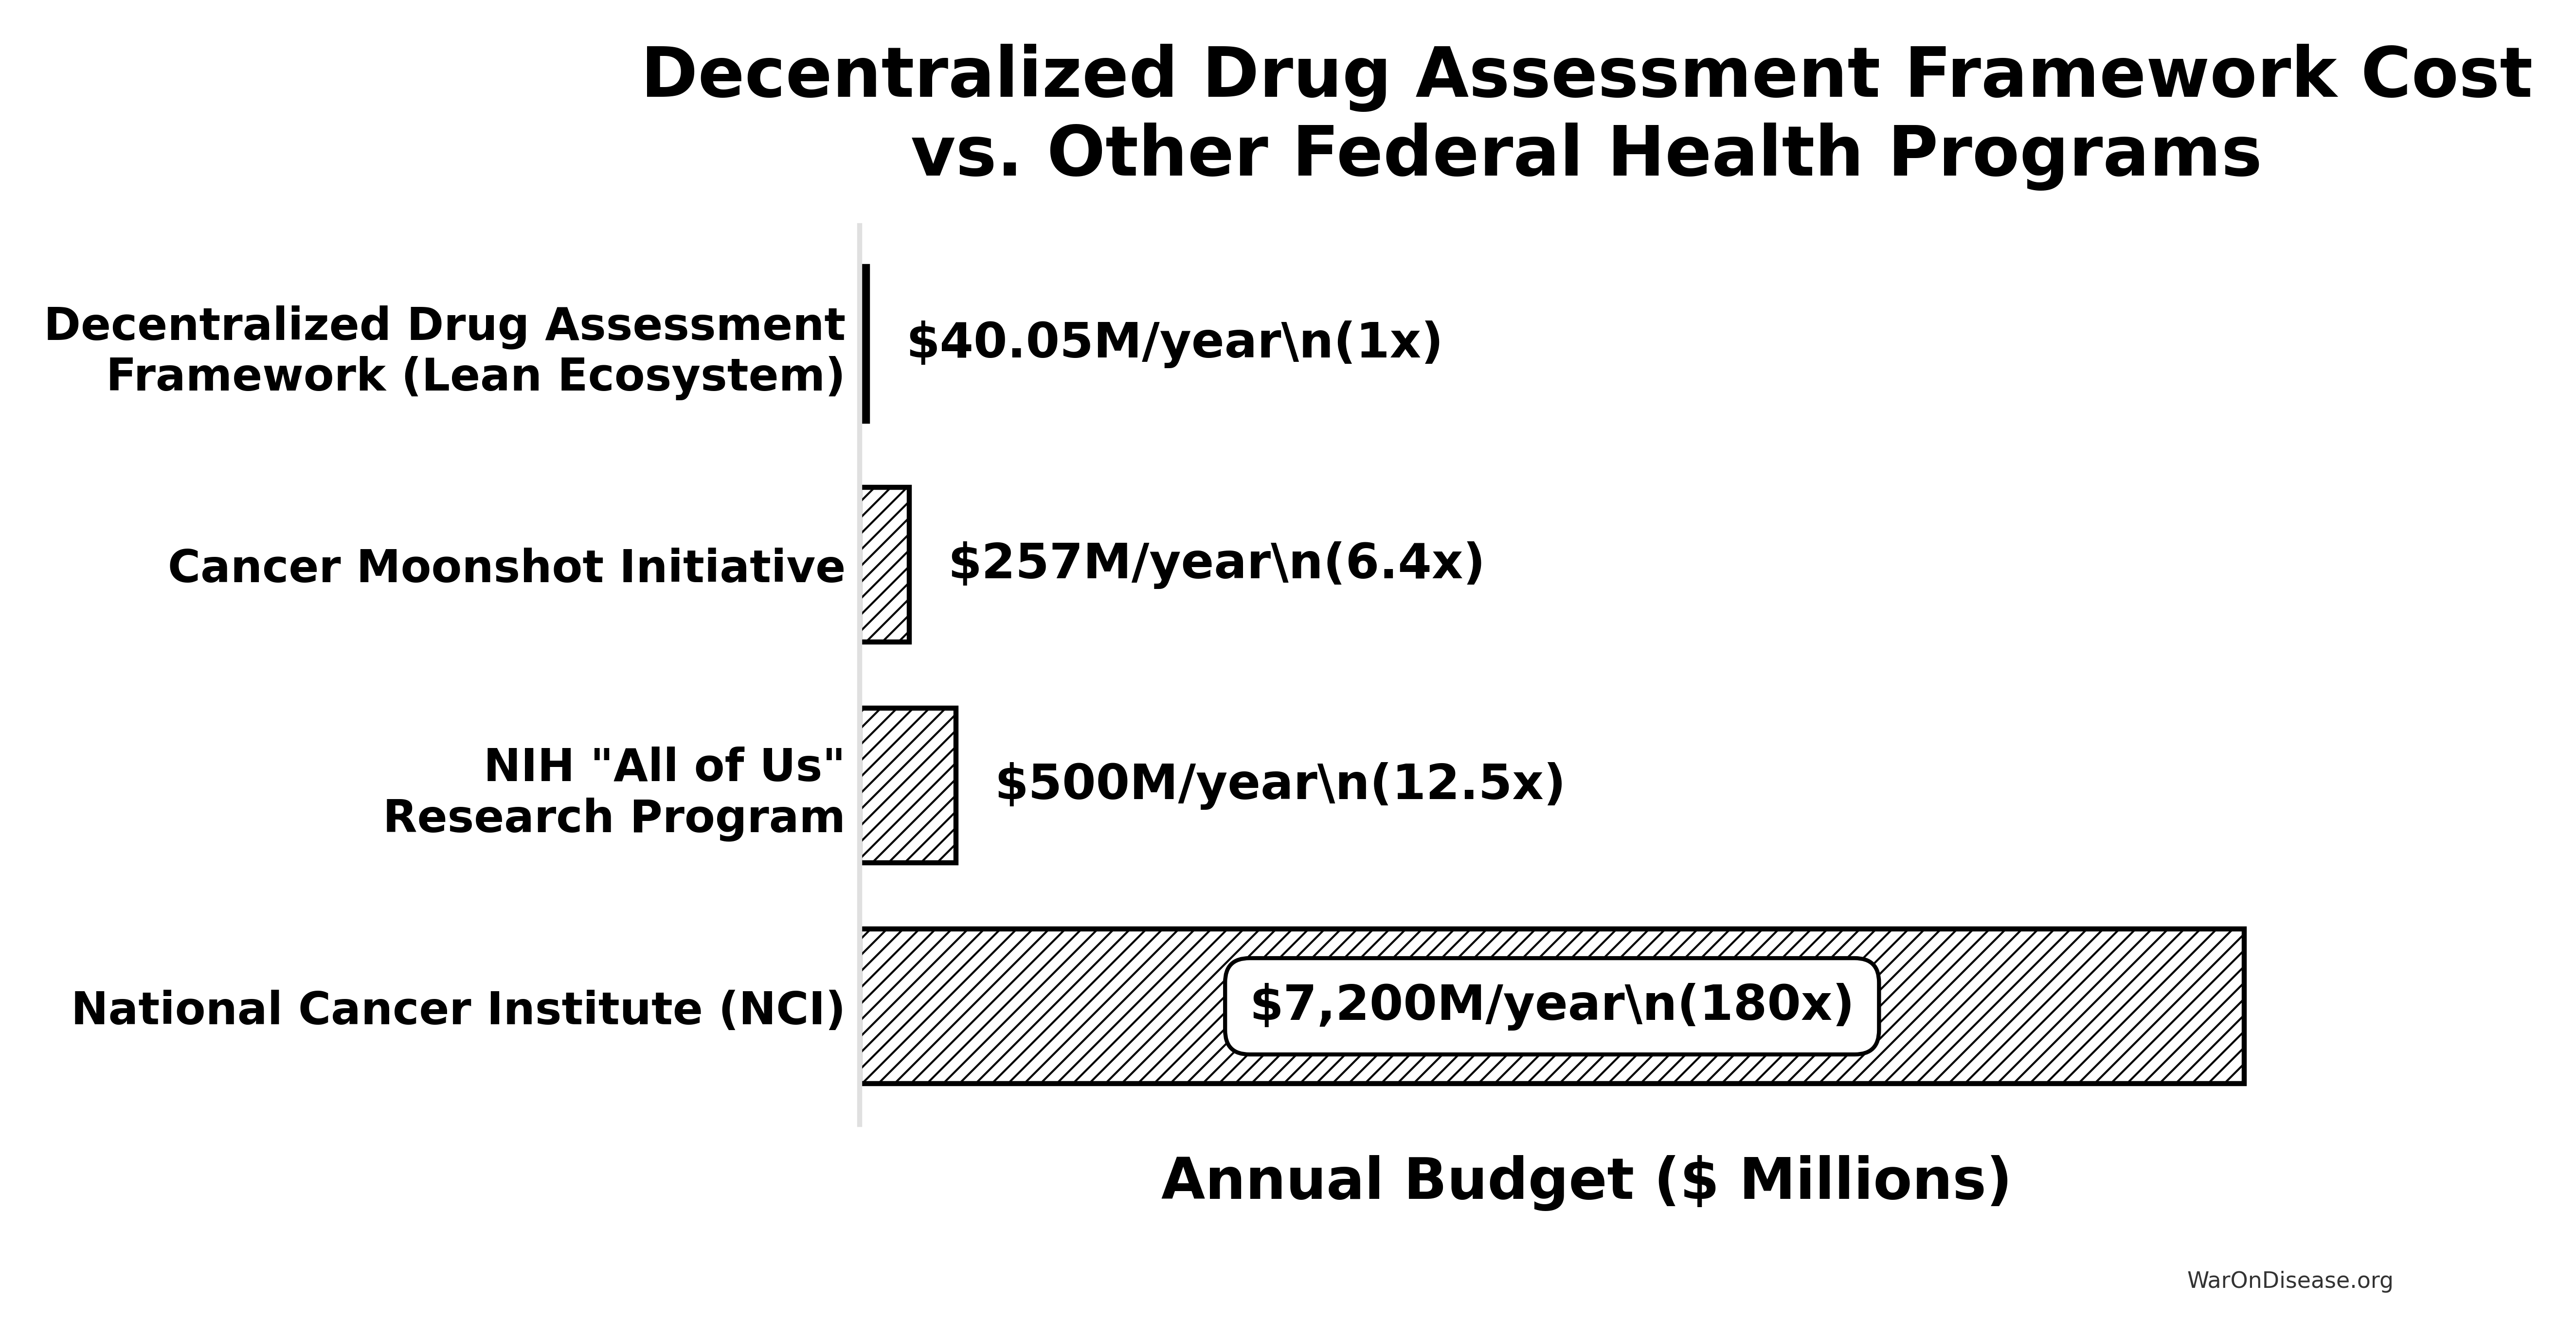
Key Takeaway: The estimated annual cost of this initiative is an order of magnitude smaller than the budgets for other major national health priorities like the “All of Us” program or the Cancer Moonshot. It represents approximately 0.55% of the NCI’s annual budget (calculated from the framework’s annual cost and NCI budget). This comparison underscores that such an infrastructure is not only a high-leverage investment (due to its massive ROI) but also a remarkably cost-effective one relative to the scale of federal health and technology spending.
Reuse
Copyright
© 2025 Mike P. Sinn