Global Clinical Trial Spending by Phase
A comprehensive breakdown of how much governments, companies, and nonprofits spend on Phase 1, 2, 3, and 4 clinical trials globally each year.
Abstract
By redirecting 1% of global military spending to hyper-efficient pragmatic clinical trials, humanity can achieve 514 years of medical research in 20 years and shift the cure of every disease forward by 8.2 years, saving 416 million lives and generating $1.2 quadrillion in value.
Keywords
war-on-disease, 1-percent-treaty, medical-research, public-health, peace-dividend, decentralized-trials, dfda, dih, victory-bonds, health-economics, cost-benefit-analysis, clinical-trials, drug-development, regulatory-reform, military-spending, peace-economics, decentralized-governance, wishocracy, blockchain-governance, impact-investing
Here’s where every dollar goes in the global clinical trials industry, broken down by who’s paying and which phase they’re funding.
The Bottom Line: $83 Billion Annually (2024)
The global clinical trials market was valued at approximately $83 billion in 2024, with estimates ranging from $54 billion to $84 billion depending on methodology.
Growth trajectory
- 2024: $83 billion
- 2030: Projected $83-132 billion
- 2034: Projected $95-150 billion
How Many People Participate? The Missing Data
Critical data gap: No global database tracks annual clinical trial participant enrollment.
What we know
- US cumulative enrollment (direct API analysis): 12.2 million participants across 100,000 active/recruiting/completed trials
- Estimated annual US enrollment: 4-5 million participants/year (based on average trial durations)
- Estimated global annual enrollment: 6-10 million participants/year (scaling from US 54% market share)
Regional snapshots
- England: 1.05 million participants in 2023/24
- US active trials (2009): Seeking 2.8 million participants
Median participants per trial (from ClinicalTrials.gov data):
- Phase 1: 33 participants
- Phase 2: 60 participants
- Phase 3: 237 participants
- Phase 4: 90 participants
Cost per participant (if $83B ÷ 5M participants): ~$16,600 annually
The tragedy: Only 0.06% of humanity participates in clinical trials each year while 150,000 die daily from disease.
See The 0.06% Problem for the full analysis.
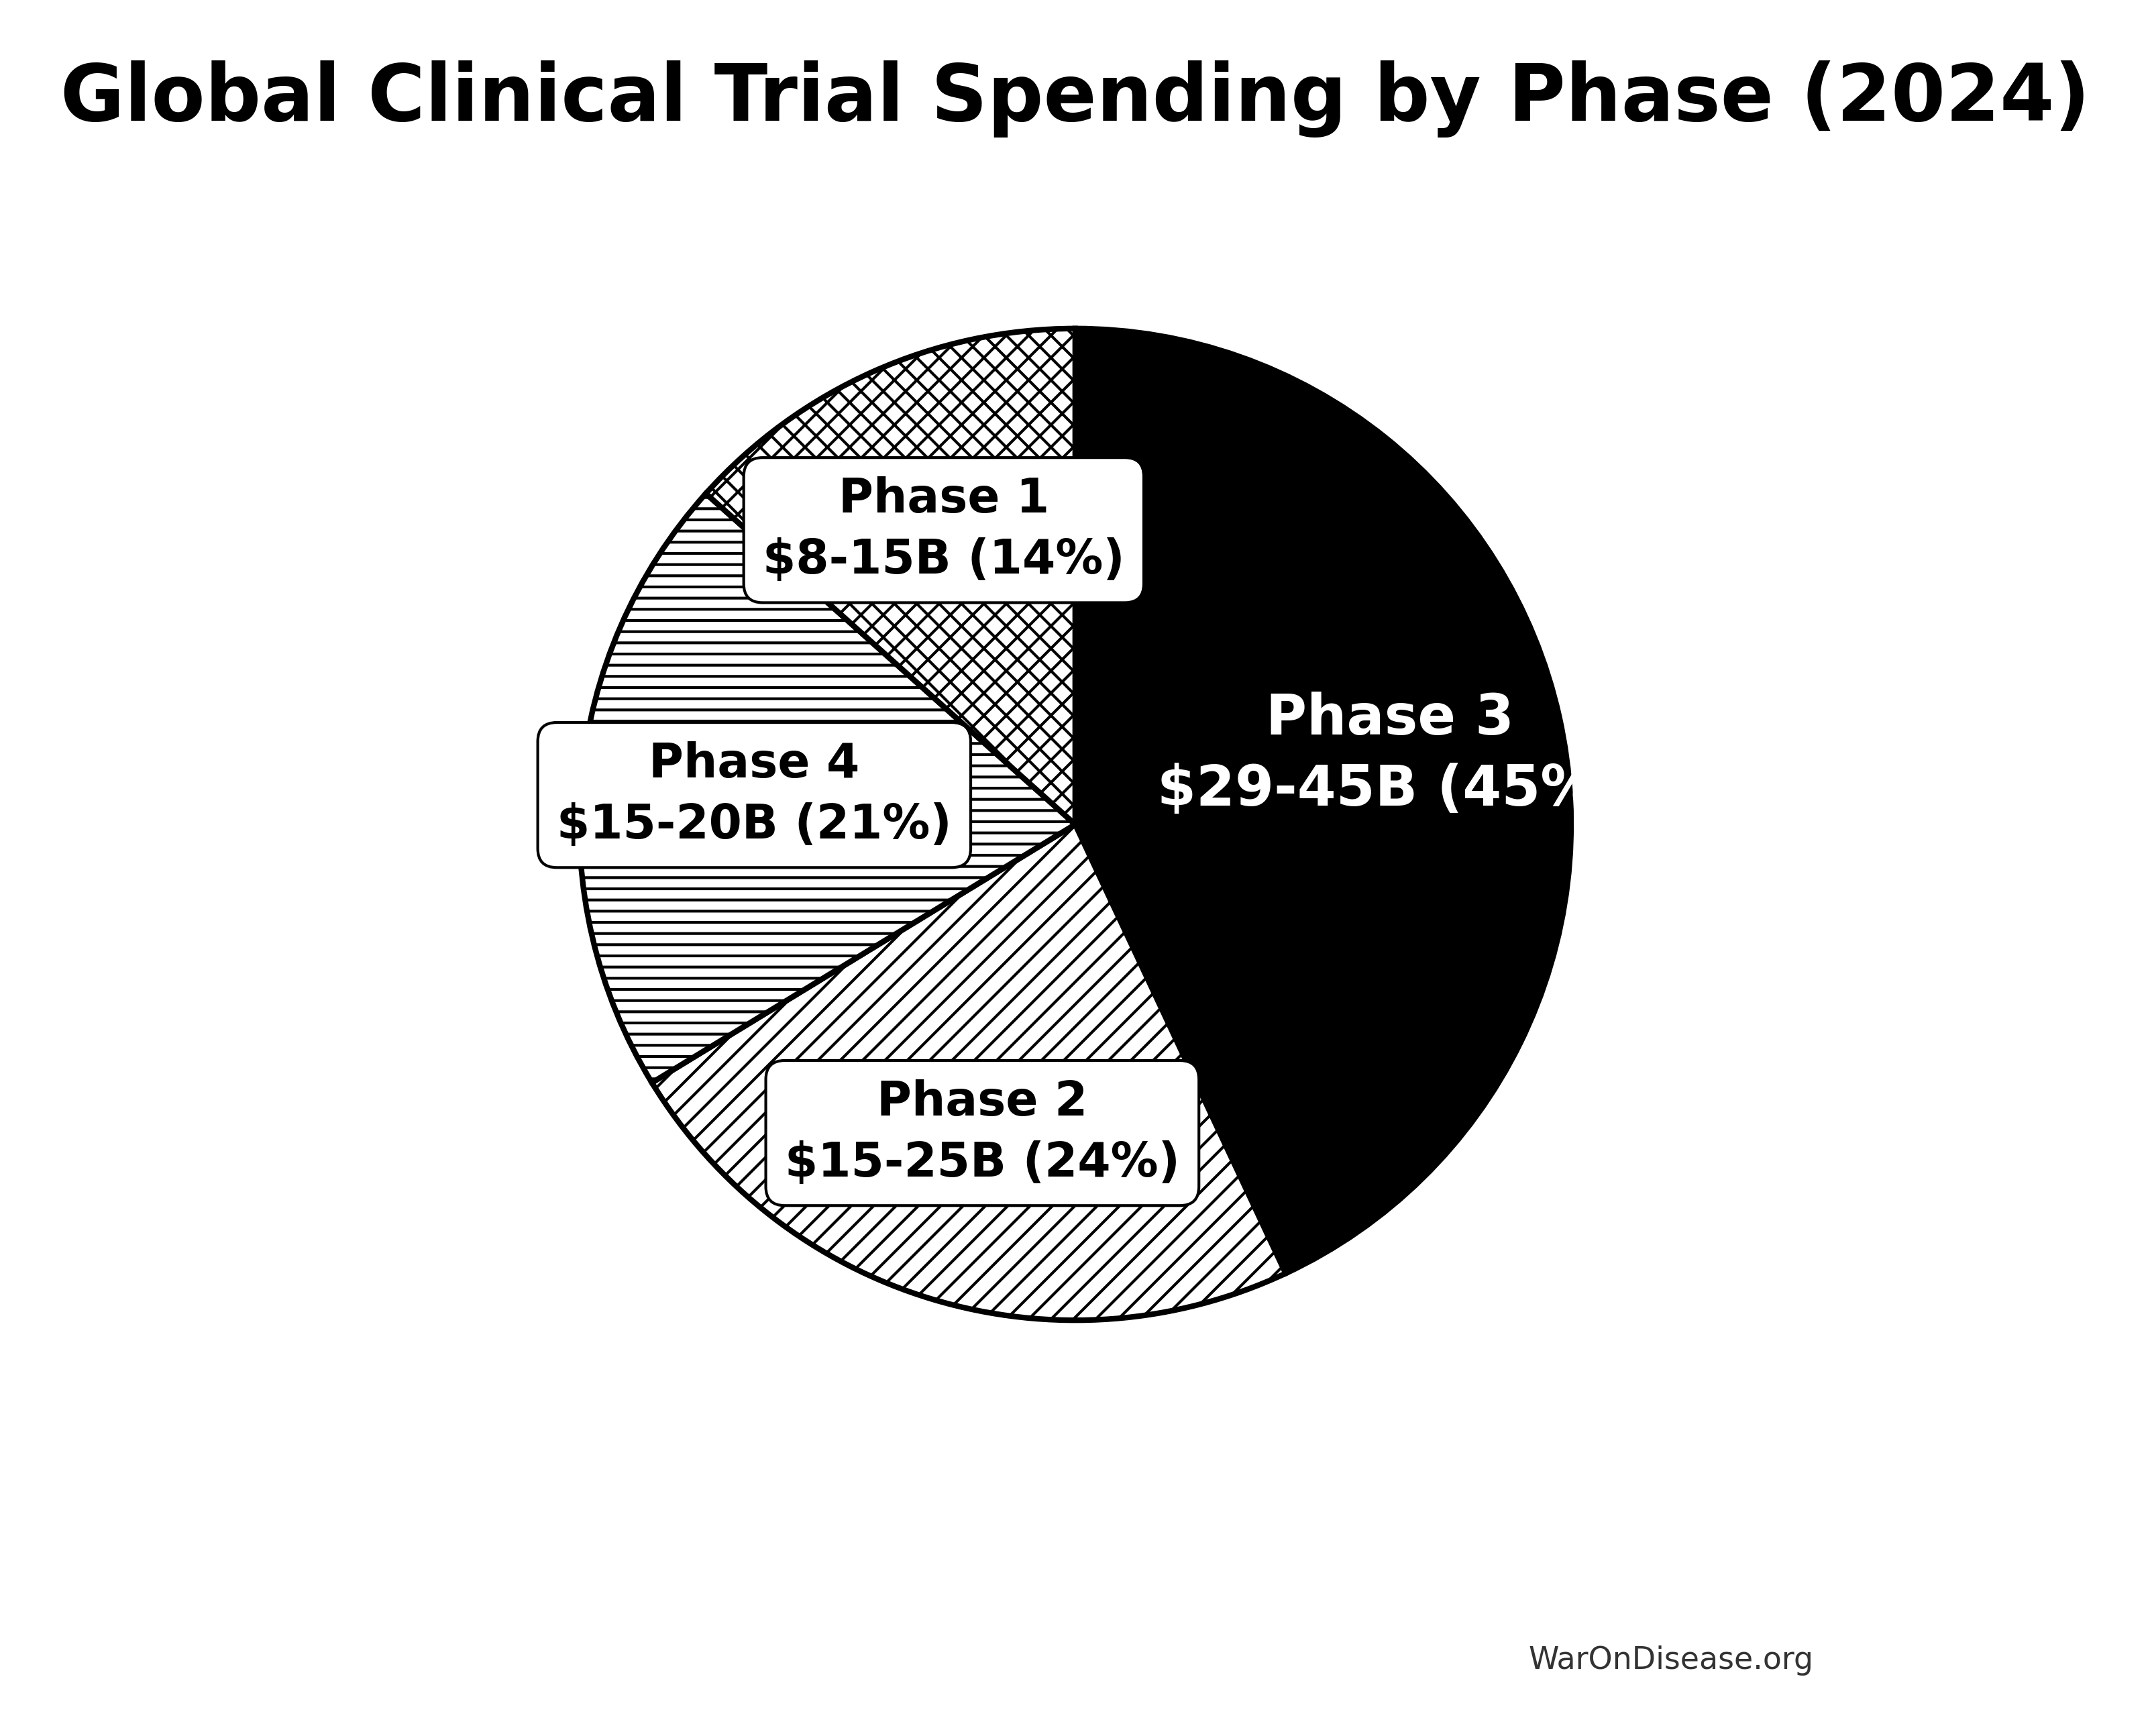
Spending by Clinical Trial Phase
Phase 3: The Money Pit
Global Spending: $29-45 billion annually (~53-55% of total market)
Why Phase 3 dominates:
- Largest market share at 53.3% of all clinical trial spending (2024)
- Requires 300-3,000 participants
- Longest treatment periods (38 months average)
- Most expensive phase per trial
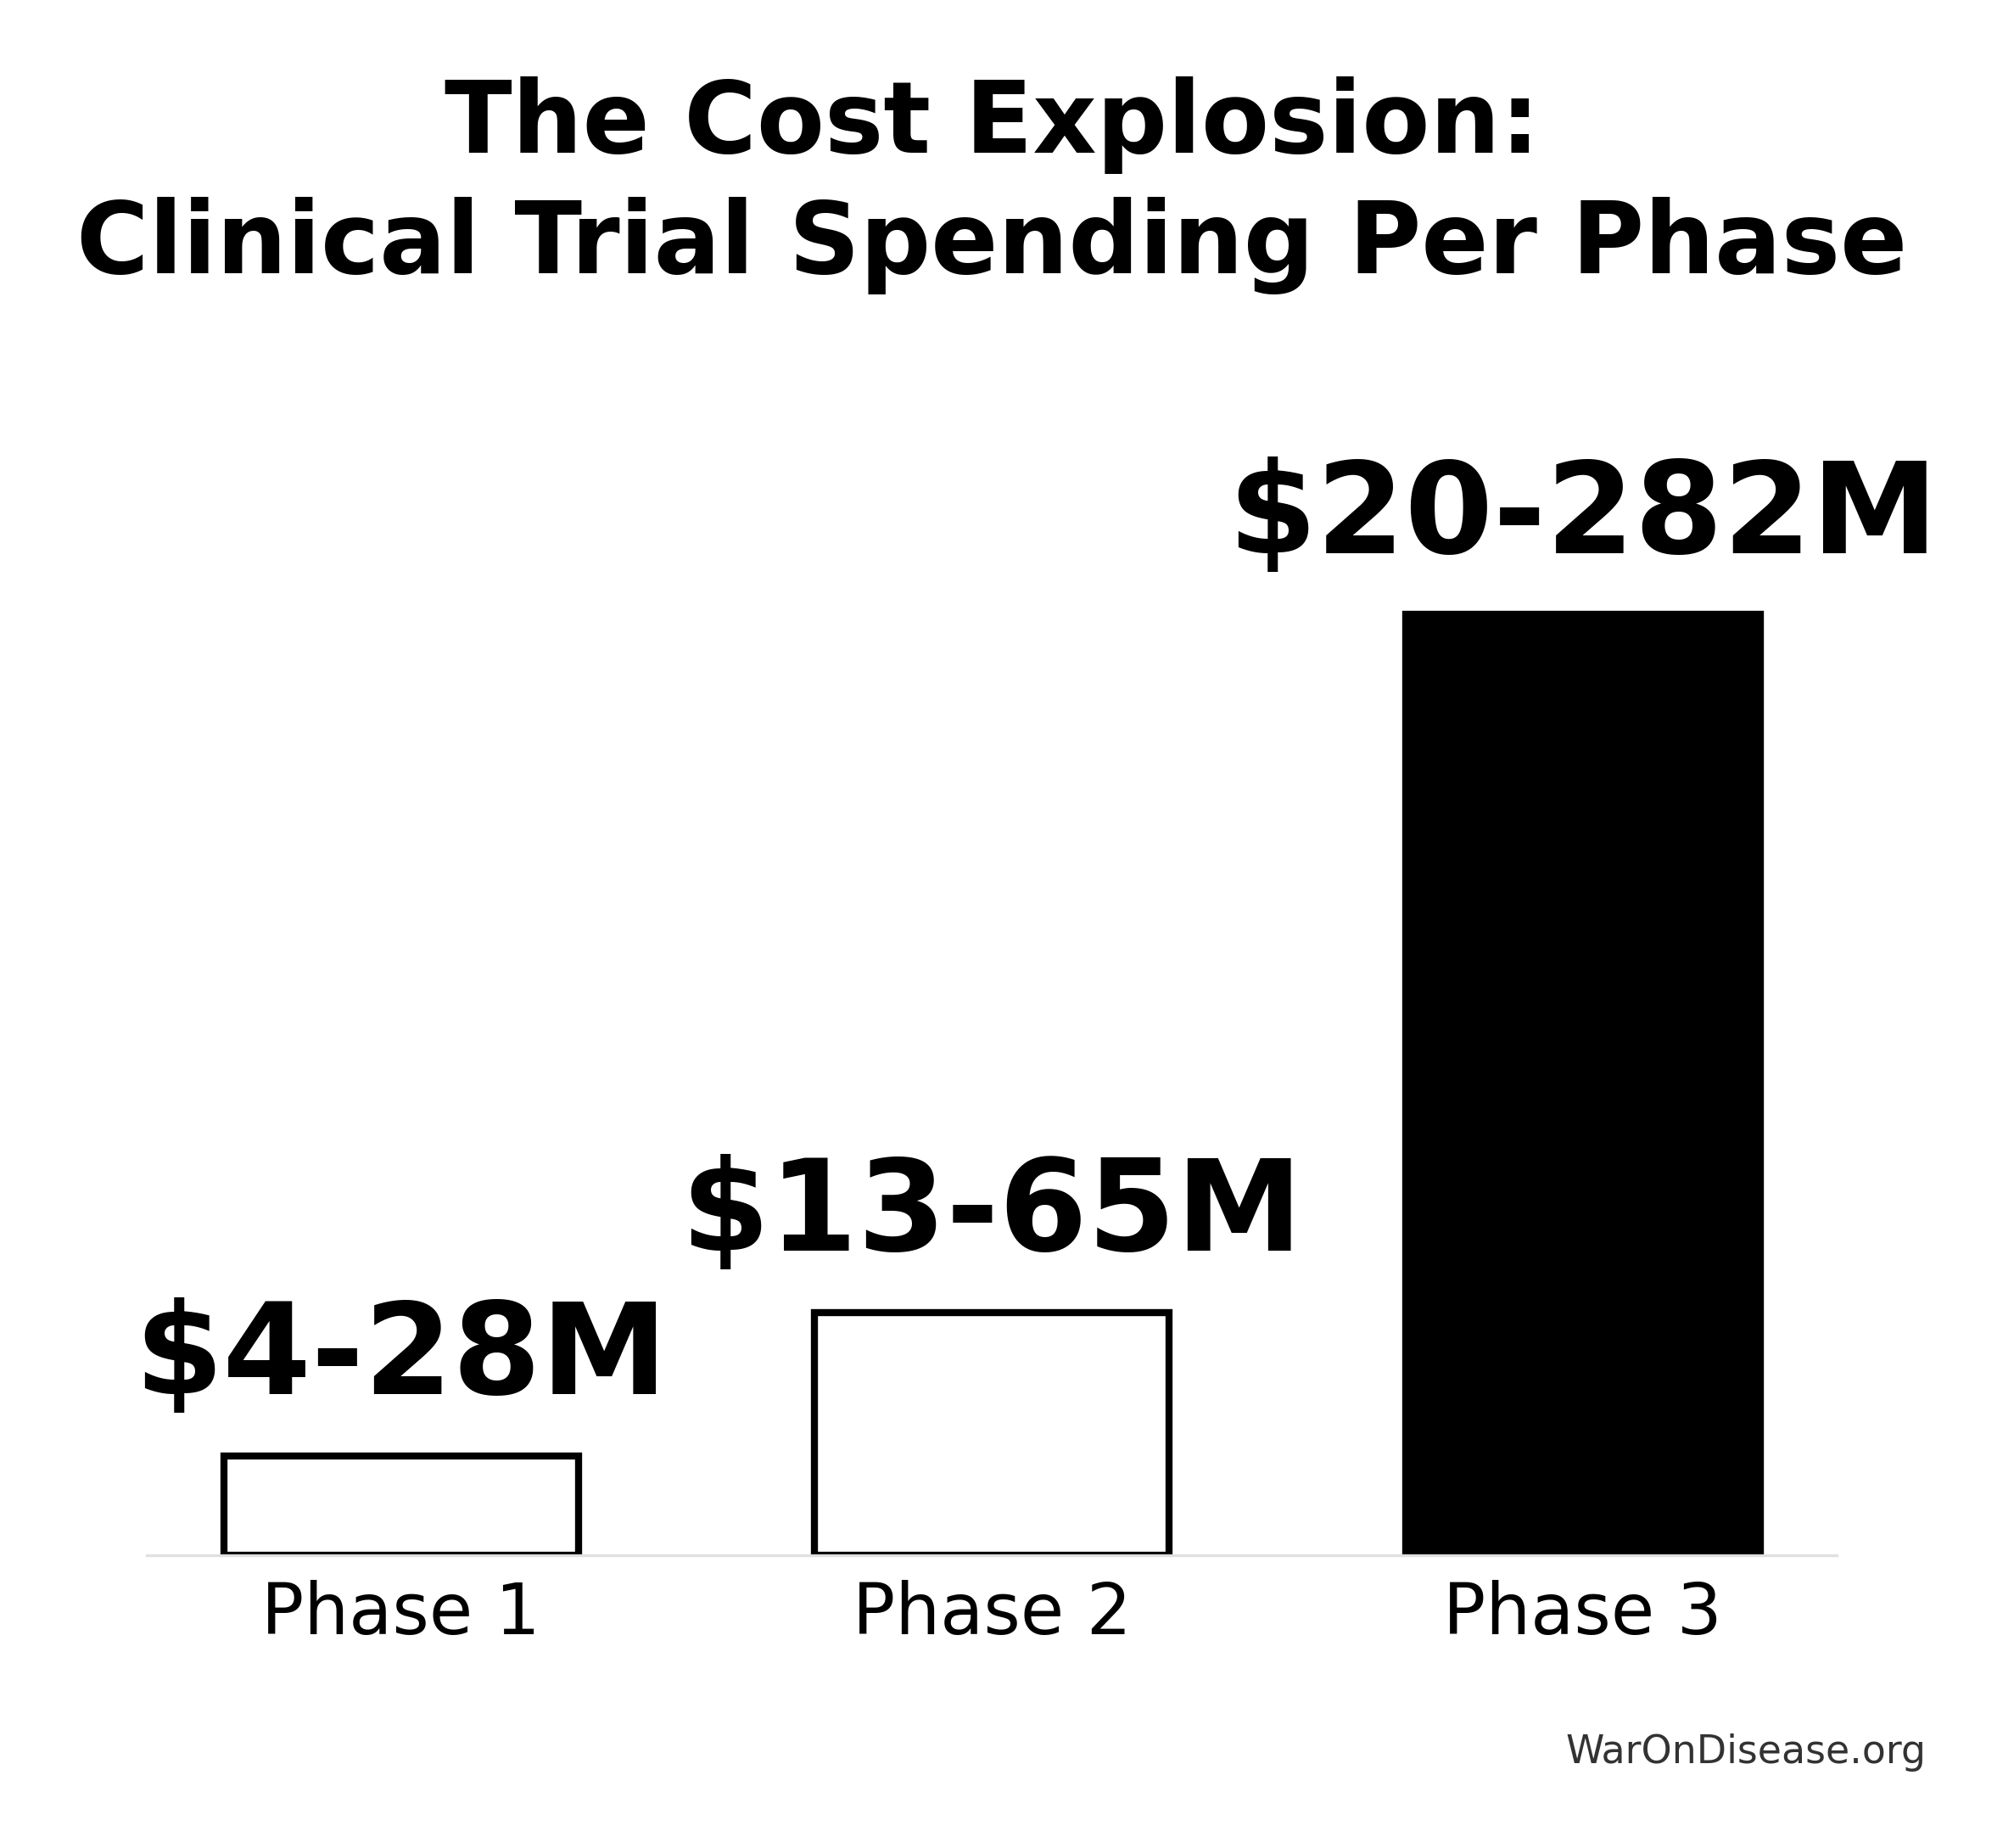
Cost per trial
- Average: $20-282 million per trial
- Median: Over $19 million per trial
- Range by therapeutic area: $11.5M (dermatology) to $52.9M (pain/anesthesia)
Cost per patient
- Traditional Phase 3: $40,000-$120,000 per patient
- Average: $113,000 per patient
As percentage of total drug development
- 39.8% of total R&D expenditure goes to Phase 3 trials
Phase 2: The Middle Child
Global Spending: $15-25 billion annually (estimated ~20-30% of market)
Cost per trial
- Average: $13-65 million per trial
- Range by therapeutic area: $7.0M (cardiovascular) to $19.6M (hematology)
Cost per patient
- Average: $130,000 per patient
As percentage of total drug development
- 17.4% of total R&D expenditure goes to Phase 2 trials
Trial characteristics
- Average participants: ~100-300 patients
- Average duration: 2-3 years
Phase 1: The Safety Gauntlet
Global Spending: $8-15 billion annually (estimated ~10-18% of market)
Cost per trial
- Average: $4-28 million per trial
- Typical: $25 million per trial
Cost per patient
- Average: $137,000 per patient (highest per-patient cost!)
As percentage of total drug development
- 9.2% of total R&D expenditure goes to Phase 1 trials (combined with proof of mechanism)
Trial characteristics
- Average participants: ~51 patients
- Average duration: 27.8 months
- 17% of all NIH-funded trials are Phase 1
Phase 4: The Forgotten Phase
Global Spending: $12+ billion annually (2007 estimate; likely ~$15-20 billion in 2024)
Key facts
- 11% of pharmaceutical R&D budgets allocated to Phase 4
- Growing at 23% annually (as of 2007)
- Also called “post-marketing surveillance” or “pharmacovigilance studies”
- Often mandated by FDA after approval
- 5% of NIH-funded trials are Phase 4
Why it matters
- Monitors long-term safety in real-world populations
- Detects rare adverse events not seen in smaller trials
- Evaluates effectiveness beyond controlled trial conditions
Who’s Paying: Funding Source Breakdown
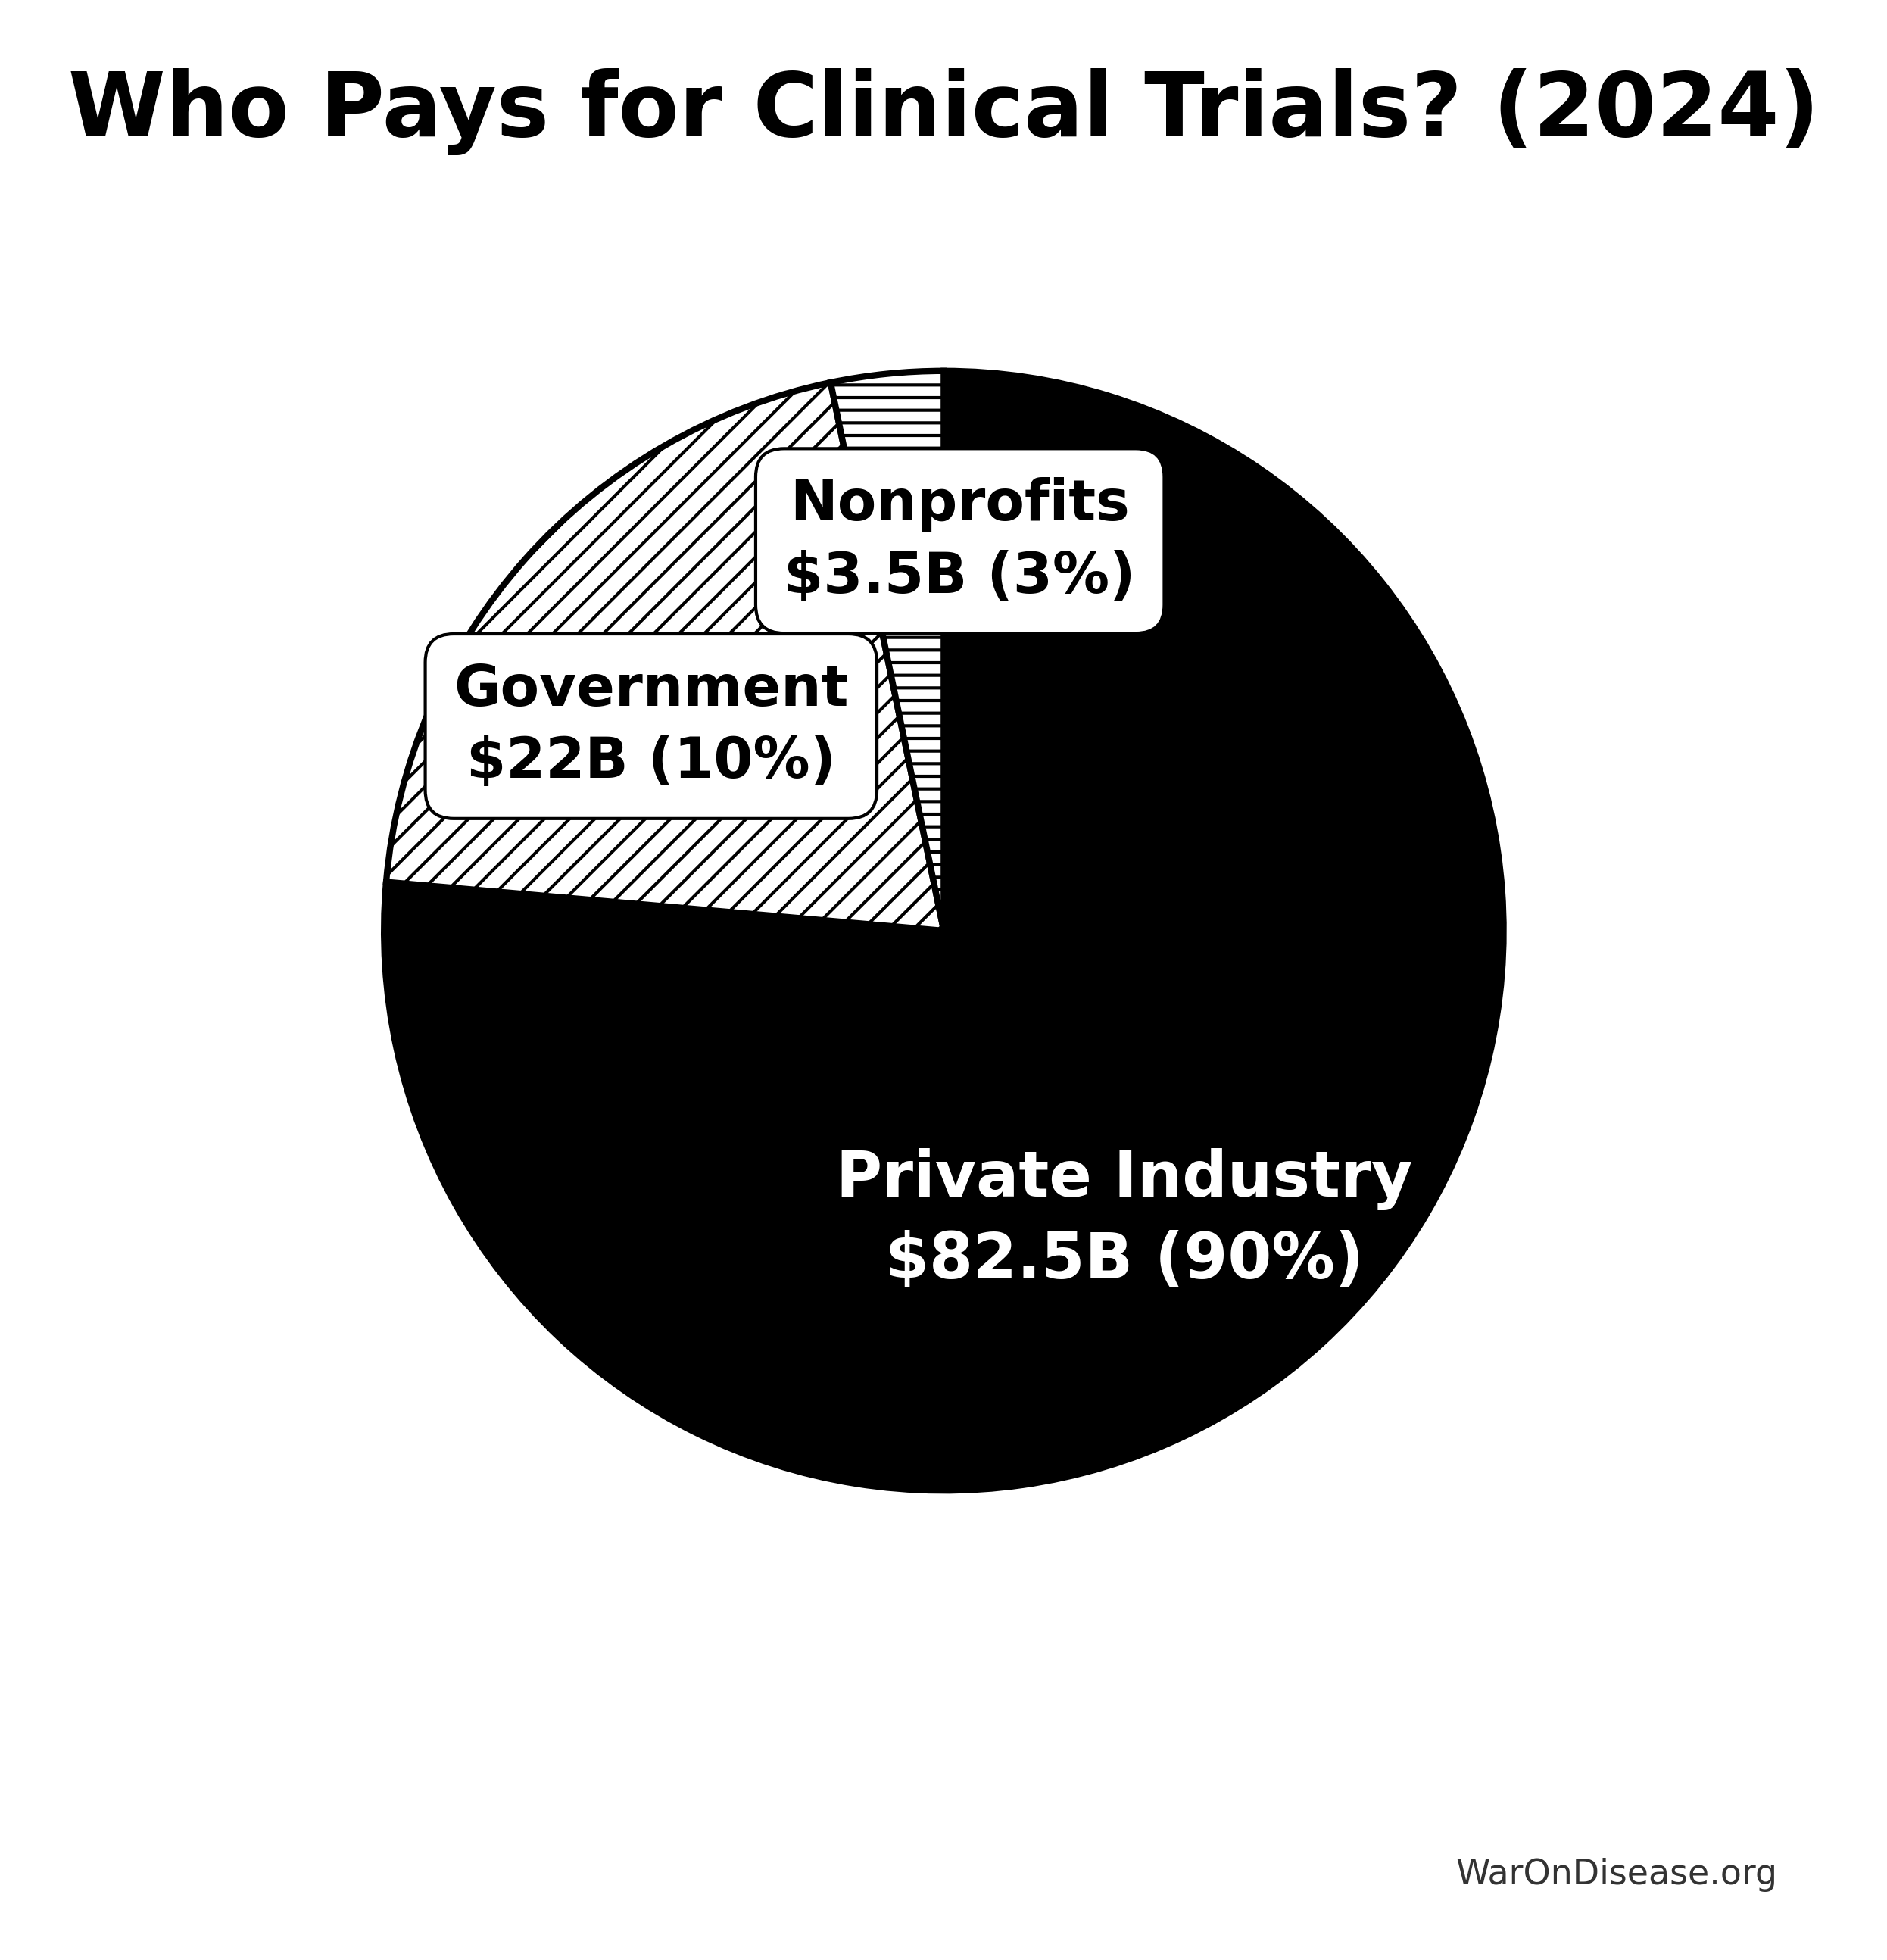
Private Industry: The Heavy Hitter
Total Annual Spending: $75-90 billion (~90% of global total)
Global pharmaceutical R&D
- Total industry R&D: $300+ billion annually
- Clinical trials portion: ~25-30% of total R&D
- Industry R&D grew 44% (inflation-adjusted) from 2012-2022: $170B → $247B
Top spenders (2024 R&D budgets)
- Pharmaceutical companies dominate funding
- Biotech firms increasingly important (especially in early phases)
- Venture capital: $146 billion invested over 3 years
Regional breakdown
- United States: Largest market for clinical trials
- US clinical trials market: $45 billion in 2024
- ~54% of global market
- China: Rising rapidly
- Europe: Steady player
- Innovative Health Initiative (IHI) under Horizon Europe funds public-private partnerships
Government: The Seed Investor
Total Annual Spending: $19-25 billion on clinical trials (~10-12% of global total)
United States (NIH)
- Total NIH budget: $47.1 billion (FY2024)
- ~80% goes to research, including clinical trials
- NIH clinical research funding: $18.9 billion (FY2023)
- NIH spent $8.1 billion on phased clinical trials (2010-2019) for drugs ultimately approved
- Only ~10% of industry spending over same period
NIH spending by phase (per approved drug, 2010-2019 data):
- Phase 1: $13.9 million average
- Represents 24.6-25.3% of industry Phase 1 costs
- Phase 2: $22.2 million average
- Represents 21.4-23.2% of industry Phase 2 costs
- Phase 3: $12.9 million average
- Represents only 3.7-4.3% of industry Phase 3 costs
- Total NIH per drug: $33.8 million (when ultimately approved)
NIH trial distribution
- 17% Phase 1
- 35% Phase 2 (largest share)
- 11% Phase 3
- 5% Phase 4
- 33% “Other” or unspecified phase
Key insight: NIH focuses on early-stage risk
- NIH covers ~25% of Phase 1 costs
- NIH covers ~22% of Phase 2 costs
- NIH covers only ~4% of Phase 3 costs
- Industry takes over once commercial potential is clearer
European Union
- Horizon Europe total: €95.5 billion (2021-2027)
- Health research portion: Billions allocated
- Horizon Europe Health Budget: €8.2 billion (2021-2027)
- ~€1.17 billion per year (~$1.3 billion)
- EU4Health Programme: €5.3 billion (2021-2027)
China
- Government R&D investment: Part of $15 billion total biopharma R&D
- Rapid growth: $35 million (2015) → $15 billion (2023)
Other major government funders
- UK: ~$3 billion annually on medical research
- Germany: ~$6 billion annually
- Japan: ~$5 billion annually
- Canada: ~$1.5 billion annually
Nonprofit Foundations: The Niche Players
Total Annual Spending: $2-5 billion globally (~2-5% of global total)
Major players (2024)
Gates Foundation + Wellcome Trust + Novo Nordisk:
- New 3-year initiative: $300 million total ($100M each)
- Focus: Climate-health, infectious disease, AMR, nutrition-immunity
- TB vaccine funding: $550 million
- Up to $150M from Wellcome, ~$400M from Gates
Gates Foundation
- Active in global health clinical trials
- Focus: Infectious diseases, vaccines, maternal/child health
- Hundreds of millions to low billions annually
Wellcome Trust
- Major global health research funder
- Clinical trial funding in infectious diseases, mental health
Other major nonprofit funders
- Cancer research charities (American Cancer Society, Cancer Research UK, etc.)
- Disease-specific foundations (Alzheimer’s Association, Michael J. Fox Foundation, etc.)
- Patient advocacy groups funding rare disease trials
Special initiatives
- COVID-19 Therapeutics Accelerator: Gates + Wellcome + Mastercard
The Brutal Economics: Cost Per Approved Drug
/tmp/ipykernel_4829/3000867792.py:44: UserWarning:

set_ticklabels() should only be used with a fixed number of ticks, i.e. after set_ticks() or using a FixedLocator.
Industry average spending on clinical trials per approved drug:
- Total clinical trial costs: $1,065 million per approved drug
- Includes spending on failed drugs (most drugs fail)
Breakdown by phase (industry average)
- Phase 1: $28 million per approved drug
- Phase 2: $65 million per approved drug
- Phase 3: $282 million per approved drug
- Subtotal for completed drugs: $375 million
- Additional $690 million: Spent on contemporaneous drugs that failed
Success rates (the depressing math)
- Only ~12% of drugs entering Phase 1 gain FDA approval
- 100 drugs start Phase 1
- ~60 advance to Phase 2
- ~20 enter Phase 3
- ~12 gain approval
Total drug development cost (preclinical + clinical):
- Estimates range from $1.0 billion to $2.6 billion per approved drug
- Tufts Center 2021 estimate: $2.6 billion
- Nearly 3× increase from $802M in 2003 (inflation-adjusted)
Regional Market Distribution
/tmp/ipykernel_4829/511585387.py:44: UserWarning:

set_ticklabels() should only be used with a fixed number of ticks, i.e. after set_ticks() or using a FixedLocator.
North America: The Dominant Player
Market share: ~50-54% of global clinical trials market
United States
- Clinical trials market size: $45 billion (2024)
- NIH: $18.9 billion in clinical research (2023)
- Industry: Remainder (~$25-30 billion)
Asia-Pacific: The Rising Giant
China
Why China is winning
- Faster and more affordable clinical trials
- Larger patient populations
- Government support for biopharma innovation
- Improved regulatory framework
Other Asia-Pacific
- India, Japan, South Korea, Australia all significant players
- Combined: Substantial portion of global market
Europe: The Steady Player
What This Actually Means
The Good News
- Industry spending grew 44% (2012-2022)
- More trials running globally than ever
- Technology enabling cheaper trials (see: RECOVERY trial at $500/patient)
The Bad News
- $83 billion annually, yet most diseases still have no treatment
- 95% of spending goes to Phase 2-3 trials for molecules that can be patented
- Success rate: 12%
- Average time to develop one drug: 10+ years
- Cost per approved drug: Rising 8.5% annually
The Context
- Global clinical trial spending: $83 billion
- Global military spending: $2.7 trillion
- Global pharmaceutical marketing: $180 billion
- Humans spend 33× more on weapons and 2× more on drug ads than on testing new treatments
The Efficiency Paradox
Current system
- $83 billion spent annually
- ~50 new drugs approved per year globally
- Cost per approved drug: $1.66 billion (using clinical trial spending alone)
- Most are “me-too” drugs (minor variations of existing treatments)
What the same money could buy (with a decentralized framework for drug assessment):
- At $500/patient (RECOVERY model): 166 million patient-participants
- At $2 million per efficient trial: 41,500 trials annually
- Instead of 50 drugs: Hundreds or thousands of treatments tested
- Instead of 10 years: Months to years
The waste
- Traditional Phase 3: $40,000-$120,000 per patient
- RECOVERY achieved: $500 per patient
- That’s an 80-240× markup for bureaucracy
Summary Table
| Category | Annual Spending | % of Total |
|---|---|---|
| Total Global Clinical Trials Market | $83 billion | 100% |
| By Phase: | ||
| Phase 3 | $29-45 billion | 53-55% |
| Phase 2 | $15-25 billion | 20-30% |
| Phase 1 | $8-15 billion | 10-18% |
| Phase 4 | $15-20 billion | ~10-15% |
| By Funding Source: | ||
| Private Industry | $75-90 billion | ~90% |
| Government | $19-25 billion | ~10% |
| Nonprofits | $2-5 billion | ~2-5% |
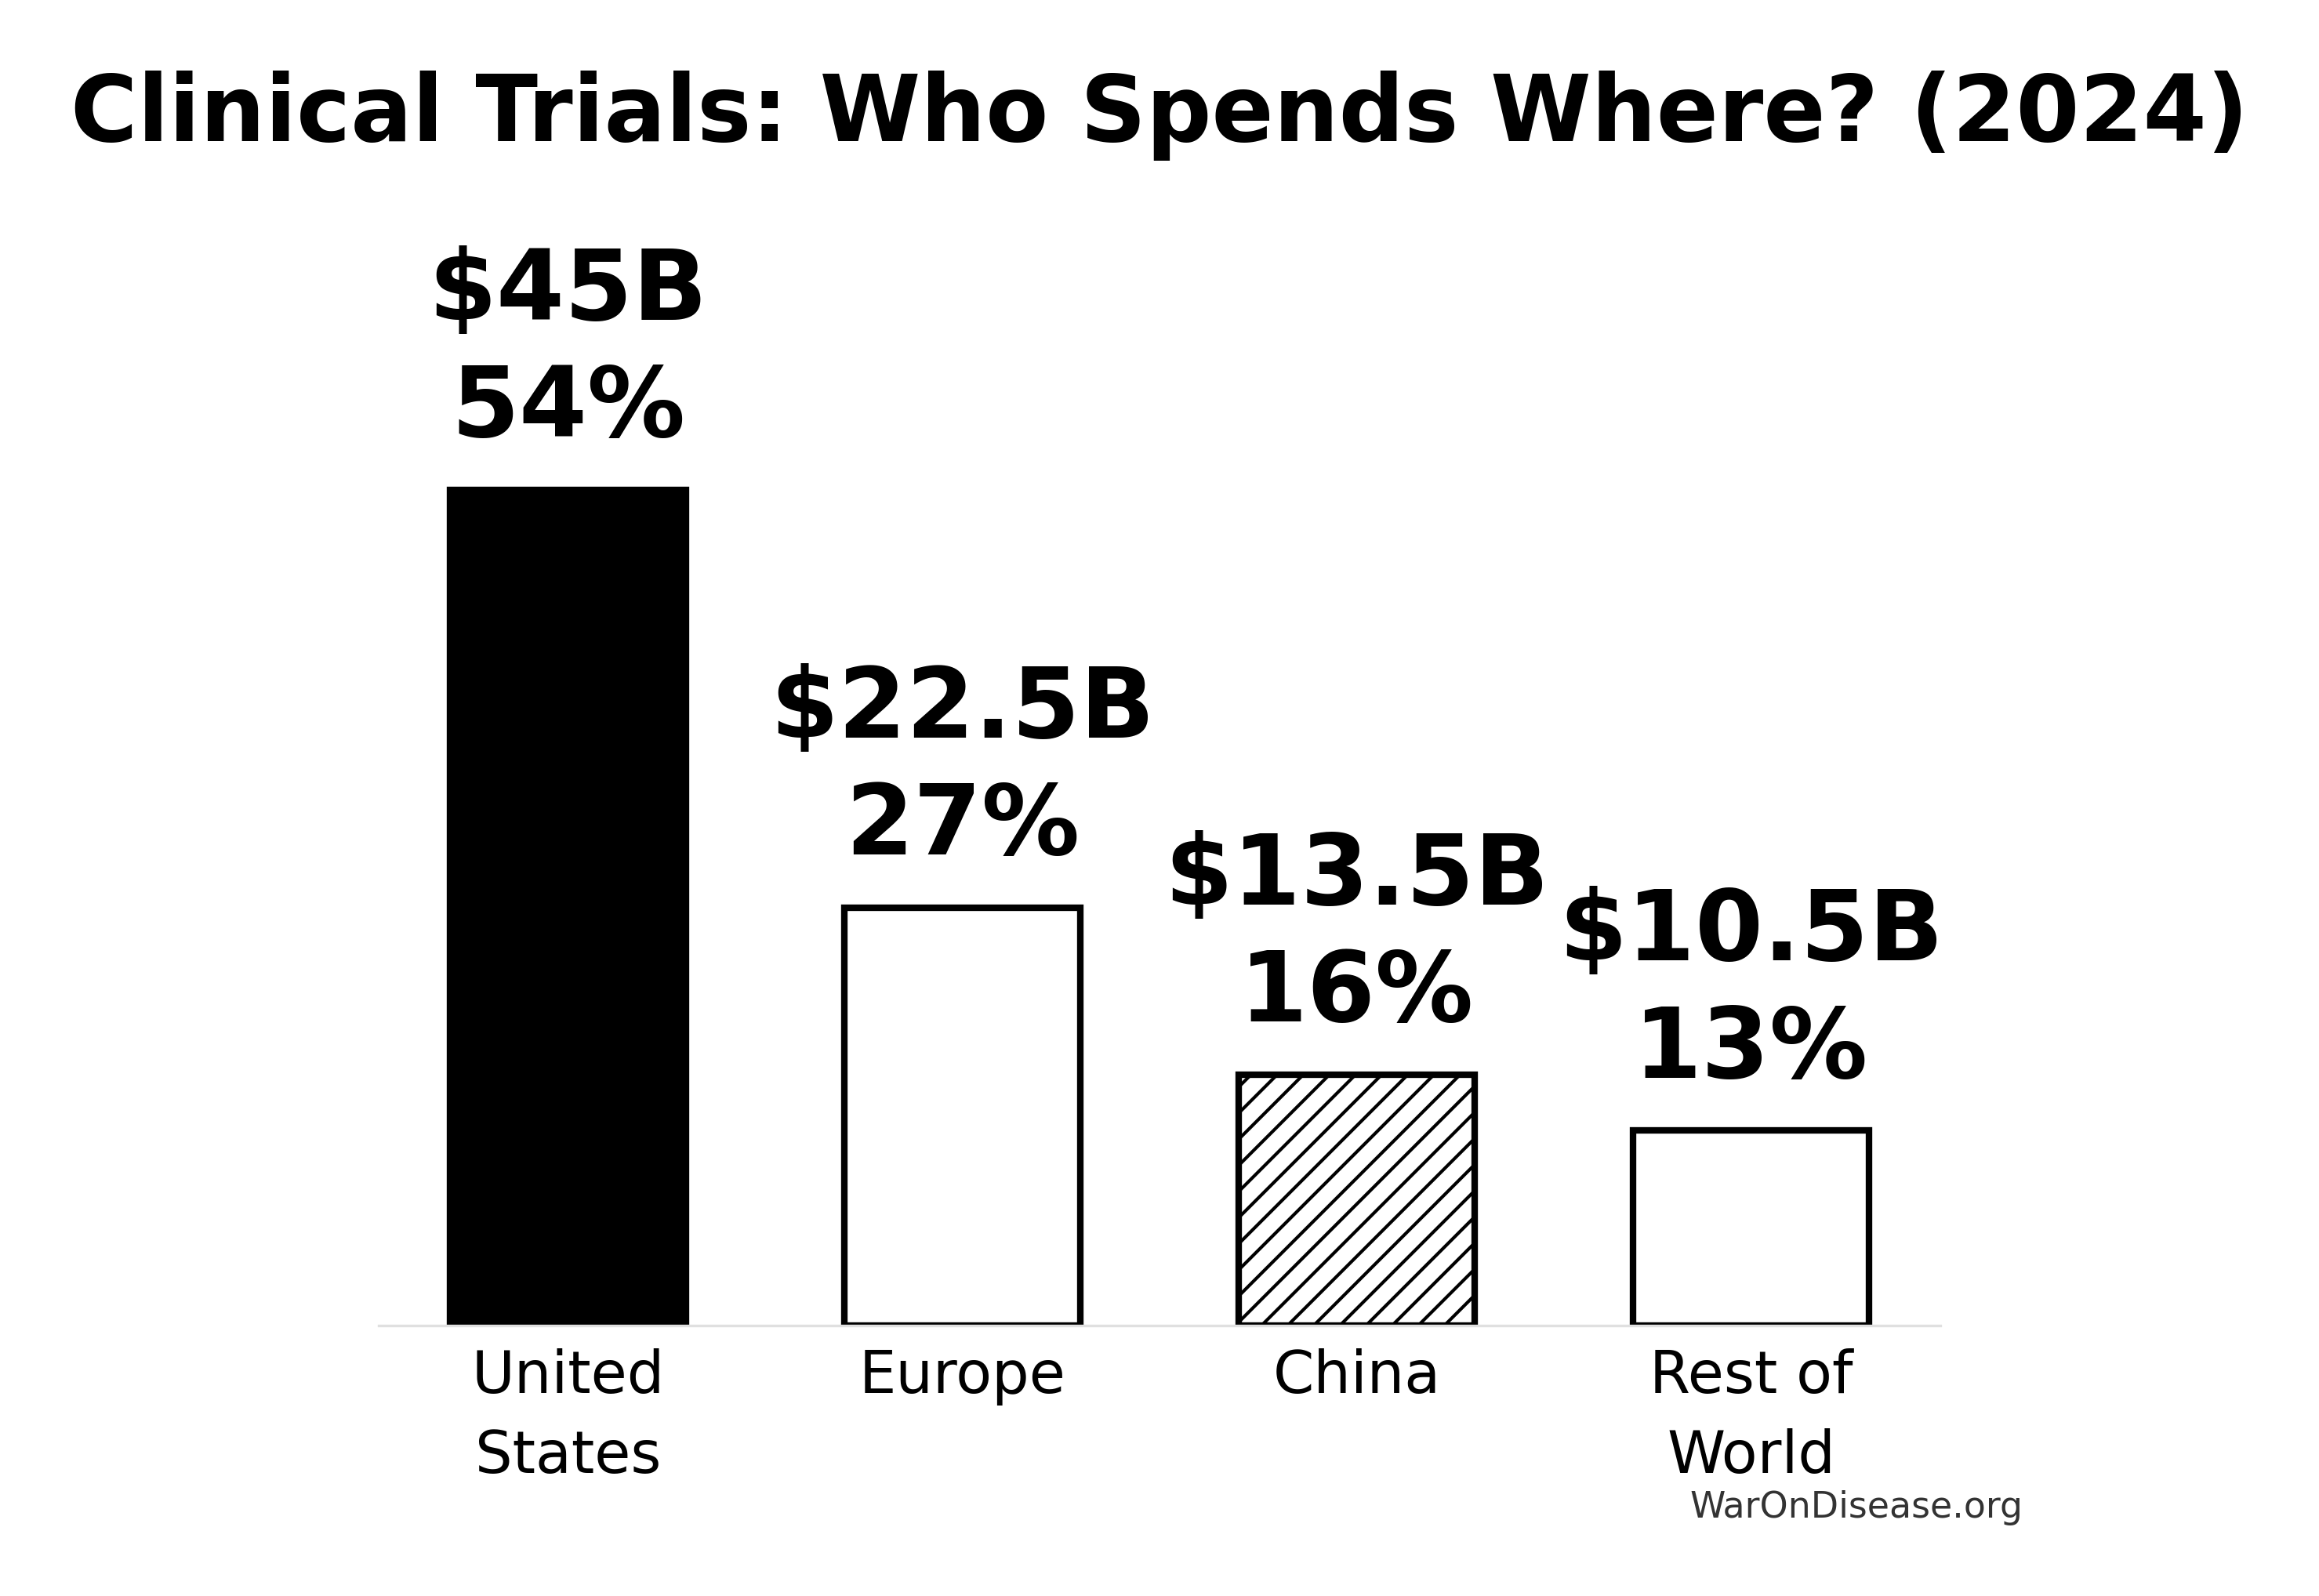
| Major Regional Markets: | ||
| United States | $45 billion | ~54% |
| Europe | $20-25 billion | ~25-30% |
| China | $12-15 billion | ~15-18% |
| Rest of World | $8-13 billion | ~10-15% |
The Path Forward
Humans spend $83 billion annually to develop ~50 drugs over 10+ years each.
A decentralized framework for drug assessment (dFDA) model could achieve 50-95% cost reduction, enabling:
- 10-20× more treatments tested
- 5-10× faster development
- Access for billions instead of thousands
The money exists. The patients exist. The technology exists.
What we lack is the political will to stop lighting $50 billion per year on fire for the privilege of bureaucracy.
Every phase, every dollar, every delay is a choice. And we’re choosing wrong.
Reuse
Copyright
© 2025 Mike P. Sinn